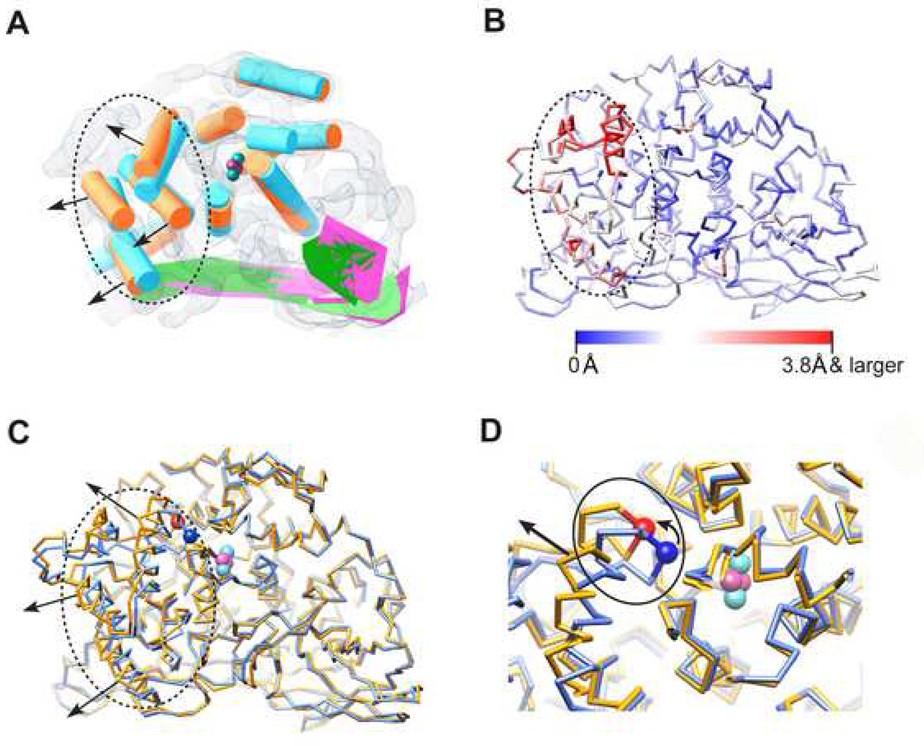
Figure 4. Conformational Variations between the Two Biochemical States.
(A) Conformational variation analysis using deduced SSEs of the two states (as in Figure 2A and 2B, same colour code adopted), which are aligned together and illustrated in the frame of the resting state map. The black dotted circle highlights the domain I region. Black arrows show the twisting direction of domain I as induced by SDS activation. The cyan and magenta spheres demonstrate the putative locations of the Cu and oxygen atoms forming the active site.
(B) Cα movement between the averaged models of the two states, mapped onto the activated state averaged Cα model. Red demonstrates larger variance (Cα movement 3.8 Å and larger) while blue demonstrates smaller variance.
(C) The aligned averaged Cα models of resting state (light blue) and activated state (gold). The same illustration style as in (A) (dotted circle, black arrow and active site) is adopted. Location of the Cα of the placeholder residue PHE49 is illustrated using blue (resting state) and red (activated state) spheres.
(D) Zoom in view of the active site with solid line circle illustrating the location of the loop region containing PHE49, which also connects to one of the domain I α-helices (indicated by black straight arrow). The small curved arrow indicates the moving direction of PHE49 as a result of SDS activation.

