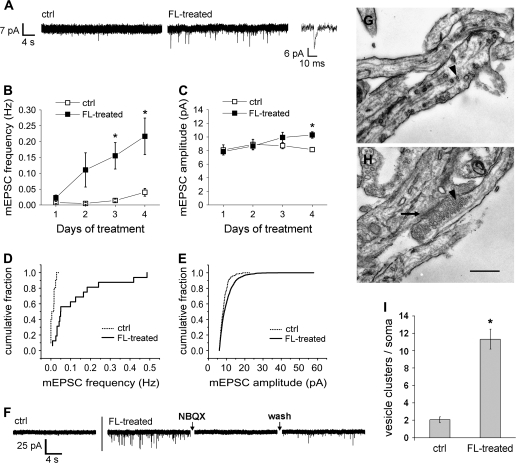
Figure 3.
Feeder layer exposure induces functional synapses that are ultrastructurally normal. (A) Whole-cell patch clamp recordings from subplate neurons grown in control wells (ctrl) or above cortical feeder layers from 5 to 8 d.i.v. (FL-treated). Downward deflections represent mEPSCs. Magnified event shows characteristic mEPSC shape. (B) Frequency and (C) amplitude of mEPSCs in subplate neurons in control wells or above feeder layers for the durations shown, beginning at 5 d.i.v. (In both control and, less frequently, FL-treated conditions, some cells had no detectable mEPSCs, leading to higher variability in the mean frequencies.) Mean ± SEM, compiled from 6 to 16 cells per time point. Asterisks = P < 0.05, Student's t-test between control and FL-treated conditions. (D) Cumulative fraction plot of mEPSC frequency in neurons grown in control wells or above feeder layers d5–8, N = 10 and 16 cells, respectively. Kolmogorov–Smirnov P < 0.001. (E) Cumulative fraction plot of mEPSC amplitude in neurons grown in control wells or above feeder layers d5–9, N = 279 and 1075 mEPSCs, from 11 and 12 cells, respectively. Kolmogorov–Smirnov P < 0.001. (F) Example traces from a control neuron, or a FL-treated neuron before, during and after perfusion of the AMPA receptor blocker NBQX (10μM) to demonstrate blockade followed by recovery of mEPSCs. Blockade and recovery observed in 6 of 6 cells tested; 1 example shown. (G, H) Electron micrographs demonstrating typical diffuse scattering of synaptic vesicles in 7 d.i.v. control cells (G) and a typical synapse in a neuron exposed to a cortical feeder layer from 5 to 7 d.i.v. (H). Arrowheads: examples of vesicles. Arrow: postsynaptic density. Scale bar = 500nm. (I) Numbers of clusters of 10 or more vesicles in a radius approximately 5 μm out from each soma. Mean ± SEM. N = 21 cells per condition in 3 experiments, P < 0.01, Student's t-test.

