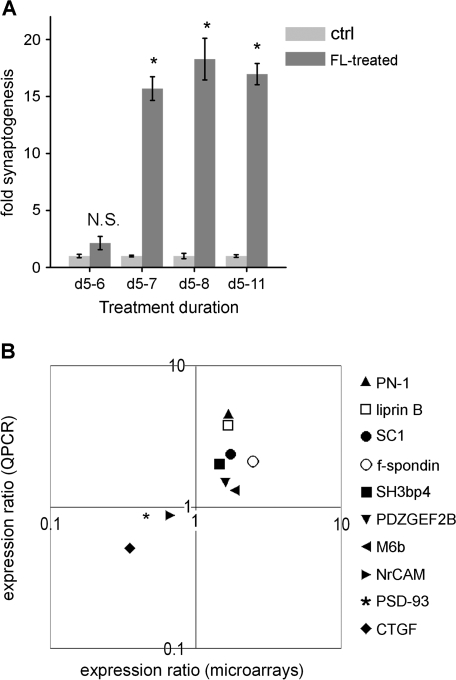
Figure 4.
Rapid synaptogenesis enables microarray experiments, validated by QPCR. (A) Subplate neurons exposed to a cortical feeder layer for increasing durations, beginning at 5 d.i.v. Fold synaptogenesis = number of colocalized synapsin and PSD-95 puncta per μm2 of actin-stained neurite, normalized to control cultures. Asterisks = P < 0.05, N.S. = nonsignificant, Student's t-test between FL-treated and respective control. Compiled from 4 experiments, 8 images per coverslip. (B) Validation of microarray results by comparison of expression ratio of selected genes in control and feeder layer-treated cultures, in microarray versus QPCR experiments (plotted logarithmically), using separate biological replicates of experiments. Microarrays: 5 replicates, QPCR: 3–4 replicates per gene. Expression ratio = expression in feeder layer-treated cells versus control cells. Note that data points fall only in the 2 quadrants, indicating that gene expression changed in the same direction on microarrays as in QPCR for every gene.

