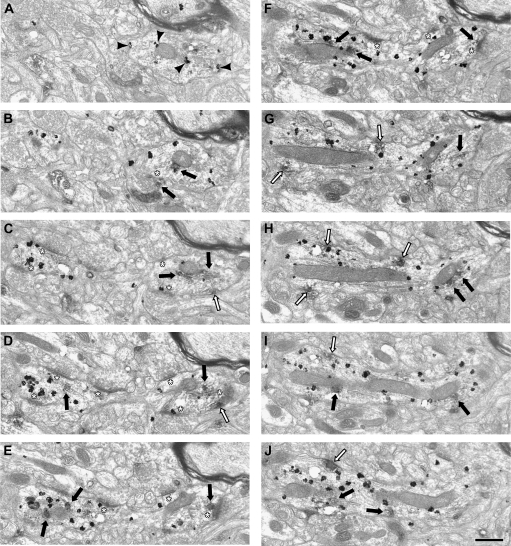
Figure 6.
Electron micrographs illustrating the distribution of D1-IR in serial sections of a PV-labeled dendrite. PV immunogold label is present throughout the dendrite and is identified by black arrowheads in panel (A). Patches of D1-IR have been identified as intracellular (black arrows) or associated with the plasma membrane (white arrows). In panel (A), no D1-IR appears in the PV dendrite. However, in panel (B), D1-IR is present and associated with the mitochondria. The beginnings of an asymmetric synapse appear (white asterisk), and the terminal contains D1-IR. Also, a continuation of the PV-labeled dendrite is present on the left side of the image. On the right side in panel (C), D1-IR is present associated with the plasma membrane as well as internal membranes. The beginnings of another asymmetric synapse are also visible (white asterisk). On the left of panel (C), 2 asymmetric synapses are visible. In panel (D), D1-IR is present internally and associated with internal membranes as well as the plasma membrane. In panels (E and F), the D1-IR is located intracellularly, and one DAB patch is directly below an asymmetric synapse in both panels. In panels (G–J), D1-IR is associated with the plasma membrane and mitochondria, and synapses are no longer visible. Scale bar is 500 nm.

