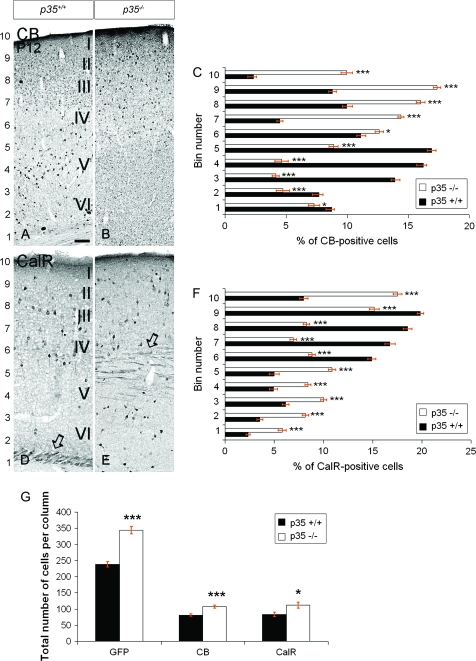
Figure 2.
The laminar arrangement and density of cortical interneurons are altered in p35−/− mice. Coronal sections of P12 somatosensory cortex showing expression of CB (A, B) and CalR (D, E). (C, F) Binned quantifications of the distribution of CB+ and CalR+ cells (mean percentage ± SEM); bin1 closest to the lateral ventricle. (G) Quantification of the number of GFP+, CB+, and CalR+ cells (mean number ± SEM). In p35+/+ mice, CB+ cells mostly populate lower layers, whereas in p35−/− mice, these cells tend to reside in the superficial cortex and LI (A, B). The relative distribution of CB+ cells in the cortex is shown in (C). In p35+/+ mice, CalR+ cells are observed predominately in the upper half of the cortex, whereas in the p35−/− animals, they populate the whole depth; note accumulation of cells in LI (D, E). CalR+ thalamocortical fibers are located below the cortex in p35+/+ (D, open arrow) and within the cortex in p35−/− mice (E, open arrow). The relative distribution of CalR+ cells in the cortex is shown in (F). Loss of p35 gene significantly increases the number of GFP+, CB+, and CalR+ cells in postnatal cortex (G). Error bars represent SEM. A significant difference in layer distribution of CB+ (P < 0.001, χ2 test) CalR+ (P < 0.001, χ2 test) cells in the cortex is observed between p35+/+ and p35−/− mice. Bin comparison is done by Student's t-test (*P < 0.05, ***P < 0.005). Roman numerals designate mature neocortical layers. Scale bar, 150 μm (A, B, D, E).

