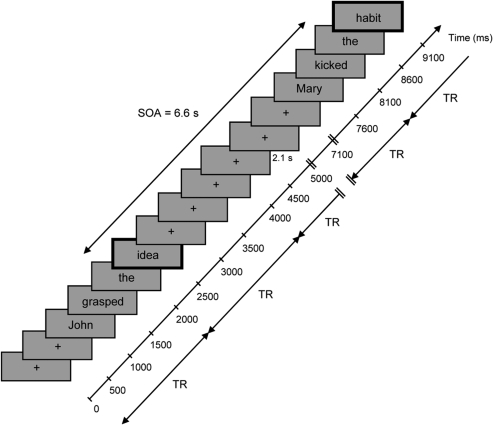
Figure 1.
Design of the experiment. Each trial was composed of 10 displays/screens, here represented by gray boxes, where the consecutive stimuli—fixation cross “+” and words making sentences—appeared each for 500 ms. Two examples of arm- and leg-action–related sentences are given. SOA between 2 consecutive critical words (indicated in bold) was 6.6 s. A fixed delay of 2.1 s, where a fixation cross remained on the screen, was inserted between 2 consecutive trials, so that the ISI varied between 2.6 and 5.1 s. The oblique axis on the right illustrates the temporal sequence of the trials and gives the onset of the corresponding stimulus (in milliseconds). TR of the EPI sequence is also represented (TR = 2 s).

