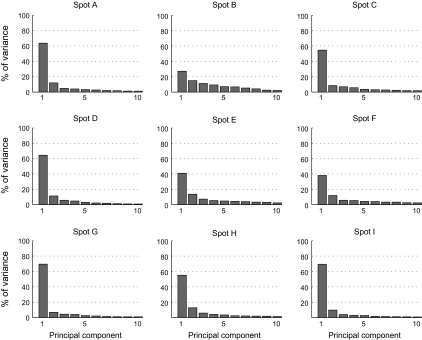
Figure 10.
Contribution of each component in PCA of MUs of each spot in the stimulus space. Each figure represents the result of the analysis applied for one of the activity spots. Horizontal axes represent rank-ordered principal components. Only first 10 components are indicated. Vertical axes represent proportion of variance explained by each principal component.

