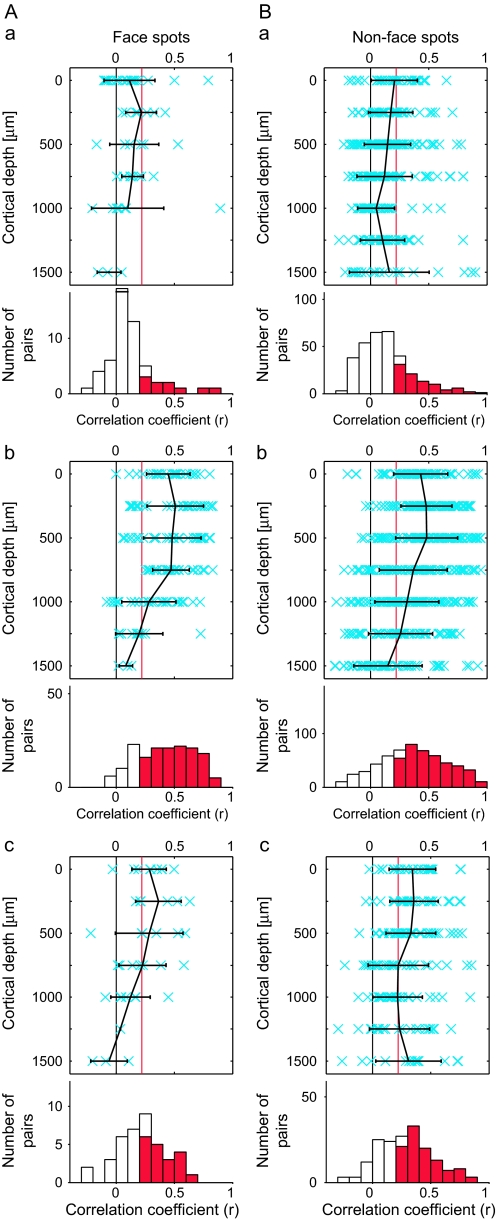
Figure 14.
Comparison between face-selective spots and the other spots for similarity in stimulus selectivity. The results for spots C and G are represented in (A), and the results for the other spots are represented in (B). The other conventions are the same as in Figure 6. In (Aa, Ba), the values of the correlation coefficient were 0.12 ± 0.21 (mean ± SD, n = 55) and 0.13 ± 0.22 (mean ± SD, n = 323), respectively. The proportions of pairs that showed significant correlation were 18.2% and 27.2% for (Aa) and (Ba), respectively. In (Ab, Bb), the values of the correlation coefficient were 0.42 ± 0.24 (mean ± SD, n = 163) and 0.37 ± 0.29 (mean ± SD, n = 567), respectively. The proportions of pairs that showed significant correlation were 76.1% and 68.4% for (Ab) and (Bb), respectively. In (Ac, Bc), the values of the correlation coefficient were 0.22 ± 0.21 (mean ± SD, n = 40) and 0.29 ± 0.23 (mean ± SD, n = 178), respectively. The proportions of pairs that showed significant correlation were 47.5% and 59.0% for (Ac) and (Bc), respectively.

