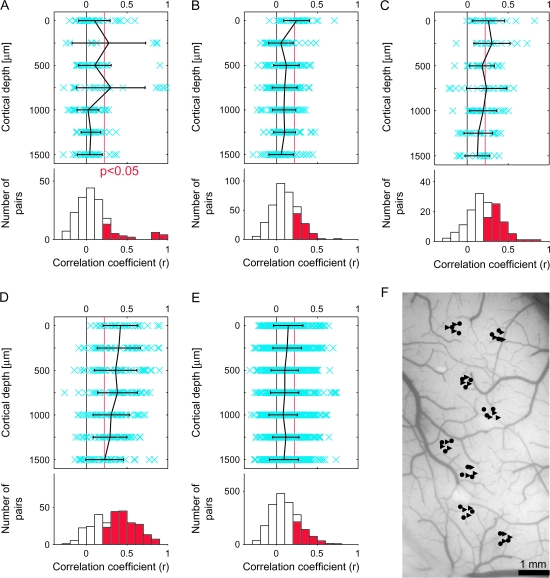
Figure 15.
Similarity in stimulus selectivity between single isolated cells, MUs, and between single isolated cells and averaged MUs in hemisphere H2, where recording sites were randomly chosen without the guidance of intrinsic signal imaging. (A, B, C) correspond to Figures 6(Aa,Ba), (Ab,Bb), and (Ac,Bc), respectively. Conventions are the same as in Figure 6. (D, E) correspond to Figures 7(Aa,Ba) and (Ab,Bb), respectively. Conventions are the same as in Figure 7. (F) represents recording sites from hemisphere H2. Density of recordings within individual sites, and site-to-site distances, was adjusted nearly the same as in H1 and H3.

