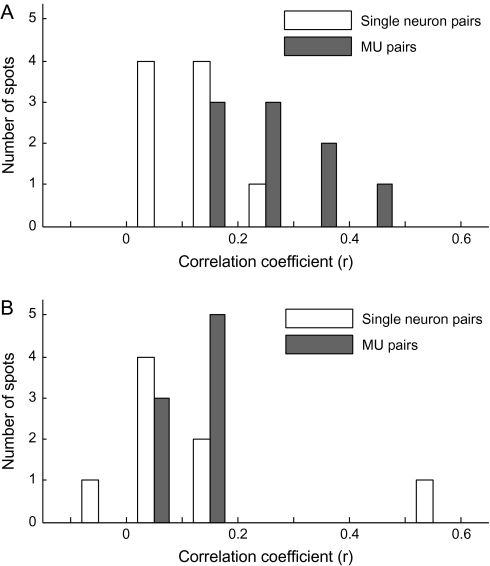
Figure 16.
Relationship of object selectivity between single-neuron pairs and MU pairs for the spots identified by intrinsic signal imaging (A) and for the randomly chosen sites (B). The mean value of correlation coefficient (r) was calculated separately for each spot, and distribution of spots was plotted against the mean values of correlation coefficient. Total number of spots was 9 (4 spots from H1 and 5 spots from H3) for activity spots and 8 for randomly chosen sites.

