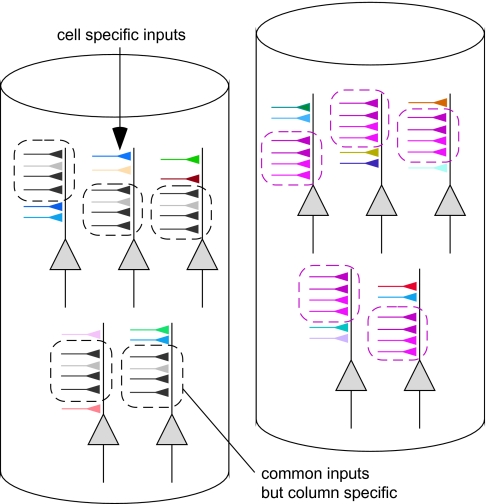
Figure 18.
Schematic drawing of cell-specific inputs and inputs common among cells within a spot. Two columns are represented. The synaptic inputs demarcated by broken lines represent common inputs. These inputs are different from column to column. In this figure, the differences in common inputs for the 2 columns are indicated by the color of the inputs (left column, gray and right column, pink). Other inputs represent cell-specific synaptic inputs. We consider that these differences in synaptic inputs generate common and cell-specific response properties.

