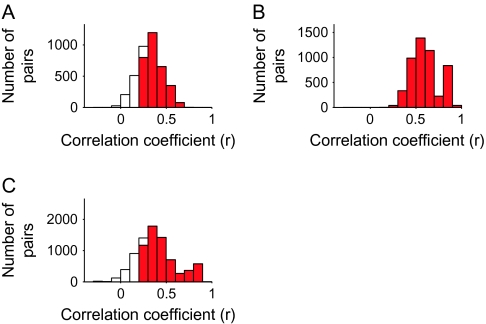
Figure 19.
Demonstration showing increase of similarity in object selectivity by averaging activities of single cells. In each hemisphere, isolated cells were divided into 2 groups with equal number, and each group is averaged. A correlation coefficient was calculated between the evoked responses to 80 object images of these 2 averaged groups. Isolated cells were divided into 2 groups in 1000 different combinations, and resulting correlation coefficients were plotted in frequency distribution against the values of correlation coefficients. (A, B, C) were the frequency distribution obtained from hemispheres H1, H3, and H2, respectively. The mean and SD of the correlation coefficients were 0.35 ± 0.11, 0.59 ± 0.16, and 0.41 ± 0.20 for H1, H3, and H2, respectively. The column in red represents the pairs with significant correlation (P < 0.05, r = 0.22).

