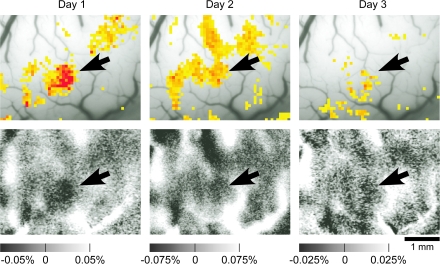
Figure 3.
Reproducible responses of intrinsic signals to an object stimulus. Upper panels indicate regions in which the reflection increases elicited by the stimulus were significantly greater than the increases of reflection caused by spontaneous fluctuation. The highest significance level is denoted by red and the lowest by yellow where P < 0.05 (t-test). Lower panels indicate reflection changes of the cortex elicited by visual stimulus presentation (see Tsunoda et al. 2001 for details). Horizontal scales represent percent changes in reflection. The optical responses at the first, second, and third days are represented from left to right. The arrow indicates reproducible active spots. The stimulus that elicited the activation was the upper-left object image in Figure 2.

