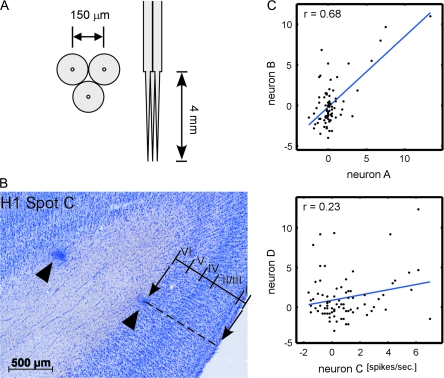
Figure 4.
Analysis of the stimulus selectivity of neurons. (A) Design of a bundle of tungsten electrodes used in this study. Left and right pictures show the bottom and side view of the electrode bundle. Electrode-to-electrode distance was designed to be about 150 μm at the tip. The exact locations of the electrodes are indicated in Figure 5. (B) A histological section of the region including one spot obtained after all the extracellular recording sessions were completed. Two arrowheads indicate the sites of electrocoagulation made at the last penetration of the spot. Based on the depths of the coagulation and borders between the cortical layers, we evaluated the relationship between depth and cortical layers (see Table 1). (C) Representative scattergrams indicating similarity in object selectivity of 2 isolated neurons. In each figure, horizontal and vertical axes indicate evoked responses of 2 neurons, and each symbol in the scattergrams indicates an object image. The values of correlation coefficient in the upper and lower panels were 0.68 and 0.23, respectively. These values were statistically significant (P < 0.05, number of object images = 80).

