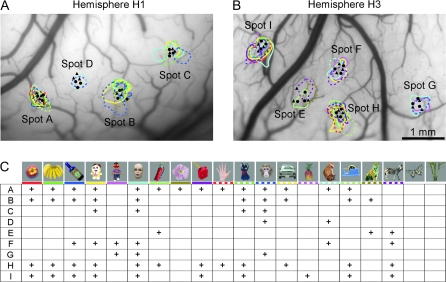
Figure 5.
Activity spots revealed by intrinsic signal imaging. (A, B) Activity spots in H1 (A) and H3 (B) were demarcated by colored contours. Penetration sites of electrodes are indicated by a filled circle (first-day penetration) and triangle (second-day penetration). (C) Optical response patterns of individual spots to 20 stimuli used in intrinsic signal imaging. Each column represents presence (cross) or absence (no symbol) of responses to the stimulus indicated on the top. Rows A–I correspond to spots A–I. The colored horizontal bar under the stimuli is to correlate a stimulus to the activity spots elicited by the stimulus in (A) and (B): The same color is used for the bar under each stimulus and for the contour of the activity spots elicited by the stimulus. Reliability of intrinsic signal imaging for an individual activity spot was assessed by calculating correlation coefficients between optical responses of the spot and averaged MUAs recorded from the spot for 20 stimuli used for intrinsic signal imaging. The resulting values of the correlation coefficient were 0.85, 0.43, 0.59, and 0.75 for spots A, B, C, and D obtained from H1 and 0.57, 0.50, 0.80, 0.29, and 0.63 for spots E, F, G, H, and I obtained from H3. Because the significant correlation coefficient value was 0.4 for 20 object images (P < 0.05), intrinsic signal imaging reliably revealed activity spots except for spot H.

