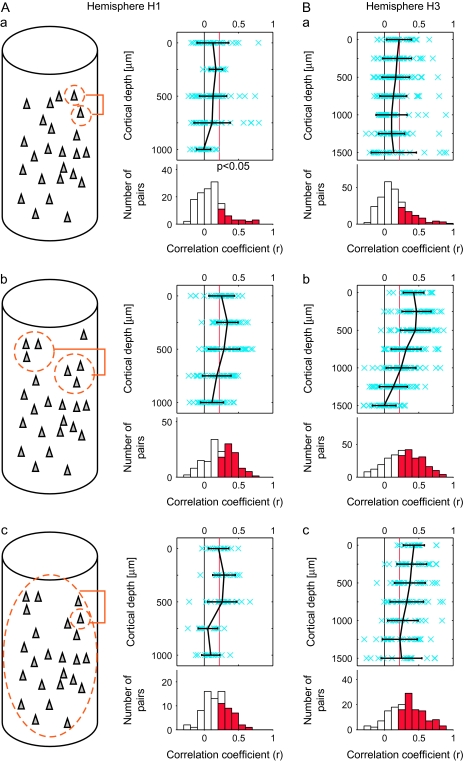
Figure 6.
Similarity in stimulus selectivity between single isolated cells (Aa, Ba), MUs (Ab, Bb), and between single isolated cells and averaged MUs (Ac, Bc). (Aa, Ba) The values of correlation coefficient (r) between evoked responses to 80 object stimuli were calculated for isolated single-neuron pairs recorded at the same depth as schematically drawn in (Aa) (inset). Upper panels in (Aa) and (Bb) represent relationships between the r values (horizontal axes) and depth of the recording sites of the pairs (vertical axes). The mean (black) and the r values of individual pairs (crosses in blue) are indicated. Error bars represent SD. The red vertical line in each panel indicates the statistically significant threshold (r = 0.22, P < 0.05 for 80 stimuli). Lower histograms in (Aa) and (Ba) represent the distributions of the pairs with respect to their r values. The number of pairs was the sum across the depth. The columns indicated in red represent the number of pairs with significant correlation. The mean value of correlation coefficient (r) and the proportion of pairs with significant correlation were 0.11 and 21.2%, respectively, in (Aa) and 0.15 and 28.5%, respectively, in (Bb). (Ab, Bb) Correlation between evoked responses to 80 object stimuli were calculated as in (Aa) and (Ba) for the MU pairs recorded at the same depths as schematically drawn in (Ab, inset). Conventions in (Ab) and (Bb) are the same as (Aa) and (Ba). In the lower histograms, the mean value of correlation coefficient (r) and the proportion of pairs with significant correlation were 0.23 and 51.9%, respectively, in (Ab) and 0.28 and 60.0%, respectively, in (Bb). (Ac, Bc) Correlation coefficients were calculated between evoked responses to 80 object stimuli of isolated single neurons and those of evoked responses of averaged MUs as schematically drawn in (Ac) left. Conventions in (Ac) and (Bc) are the same as (Aa) and (Ba). In the lower histograms, the mean value of correlation coefficient (r) and the proportion of pairs with significant correlation were 0.18% and 40.0%, respectively, in (Ac) and 0.32% and 65.7%, respectively, in (Bc); (A) are the results obtained from spots A–D (H1), and (B) are from spots E–I (H3).

