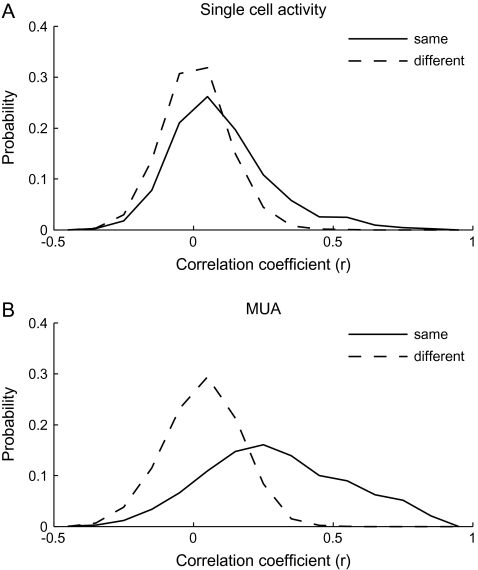
Figure 8.
Demonstration that common response properties existed for the cells within an activity spot but did not for cells across the activity spots. (A) Distributions of single-neuron pairs with respect to the values of the correlation coefficients between evoked responses to 80 stimuli of the cells in each pair. The solid line represents the distribution of pairs where cells were chosen from the same spots and the dotted line represents the distribution of pairs where cells were chosen from different spots. (B) Distributions of MU pairs with respect to the values of the correlation coefficients between evoked responses to 80 stimuli of the MUs in each pair. As in (A), the solid line represents the distribution of pairs of MUs from the same spots and the dotted line represents the distribution of pairs of MUs from different spots. Please note that the constituent members of a pair were chosen regardless to the depth that they were recorded from. Thus, in contrast to Figure 6, the members of pairs do not necessarily located close to each other even they are recorded from the same spot.

