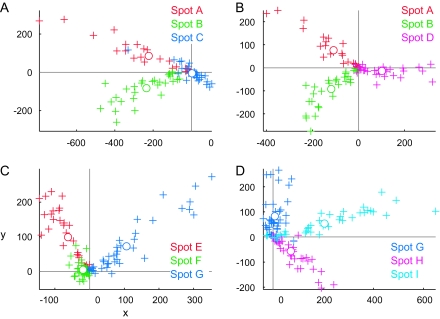
Figure 9.
Distribution of MUs in the stimulus space indicating that MUs of each spots are clustered together. MUs and averaged MUs of activity spots are plotted on the stimulus space, that is, 100 dimensional space in which each dimension represents responses (spikes/s) to one of the 100 object images. We chose the 2D plane that includes points representing responses of averaged MUs of 3 spots to demonstrate clustering MUs of the 3 spots in each figure. Crosses, responses of MUs projected on the 2D plane. Open circles, responses of averaged MUs. Different colors indicate different spots. (A, B) Represent MUs of the spots in hemisphere H1. (C, D) Represent MUs of the spots in hemisphere H3.

