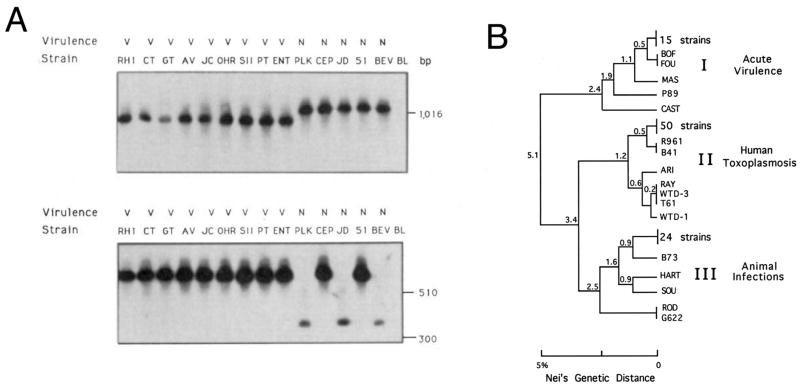
Fig. 1.
Demonstration of clonality in Toxoplasma gondii. A) Analysis of T. gondii strains for polymorphisms using two genetic markers SAG1 (top) and 850 (bottom). All of the mouse-virulent clones shared the same genotype at both marker (and subsequently many others that were tested) while non-virulent clones differed. Note that biallelism was evident in these early markers. Reproduced with permission from Sibley and Boothroyd (1992b). B) Phylogenetic tree of 106 strains analyzed by Dane Howe using six polymorphic markers. Three predominant clones typified the population structure. This pattern was later shown to be characteristic of North America and Europe. While this pattern has largely held up over the years, not all strains shown here are in fact members of the clonal lineages, or have the precise phenotypes shown to the right. For details on a more current analysis of these and others strains see Khan et al. (2007) and Sibley and Ajioka (2008). Phenotypic correlations of these lineages are shown at the right. Genetic distance was extrapolated from restriction fragment length polymorphism differences according to Nei’s genetic distance. Reproduced with permission from Howe and Sibley (© 1995 by the Infectious Diseases Society of America).

