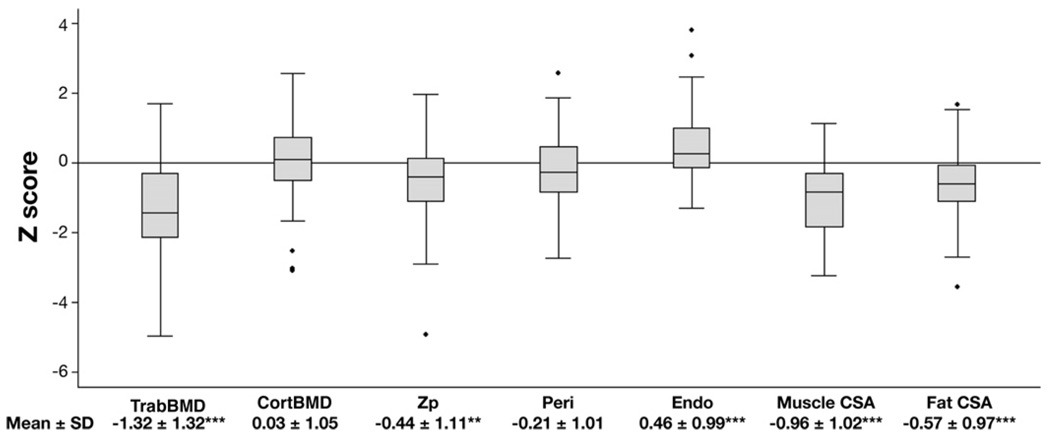
Figure 1.
PQCT bone and body composition z scores in 78 subjects with Crohn’s disease at diagnosis. The box plots represent the z score distributions. The mean ± SD results are provided below each plot. Peri, periosteal circumference z score; Endo, endosteal circumference z score. *P < .05, **P < .01, ***P < .001.

