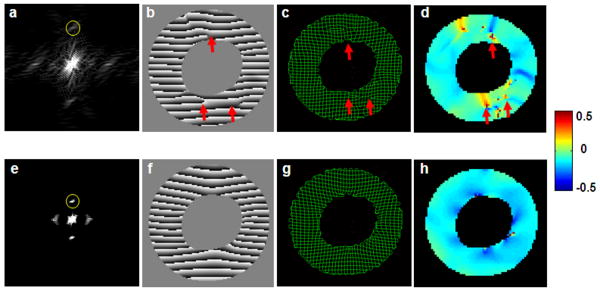
Figure 2.
a&e. k-space images of a composite image with high tagging resolution and an original image with low tagging resolution, respectively. Yellow circles show the band-pass filter for harmonic peak extraction. b-d. representative HARP image, tag tracing, and E2 strain map generated by extracting the second-order harmonic peak in a. f-h. representative composite HARP image, tag tracing, and E2 strain map generated by extracting the first-order harmonic peaks from the original images of low tagging resolution. Arrows indicate artifacts and inaccuracies in tagline tracing and strain calculation.

