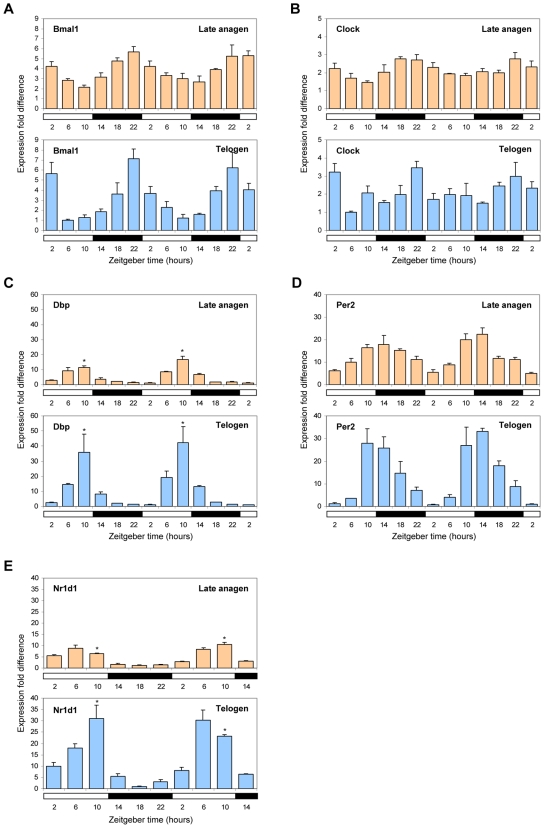
Figure 3. Enhanced circadian expression of CLOCK–regulated genes during telogen.
Q-PCR of Bmal1 (A), Clock (B), Dbp (C), Per2 (D), and Nr1d1 (E) in telogen compared to late anagen dorsal skin over the course of 48 hours (open and filled bars along the x-axis denote 12 hours light and dark phases, respectively). Expression is normalized to Gapdh and fold calculated relative to the lowest expression time point for both telogen and late anagen. Each error bar represents the S.E.M. for independent measurements from four mice. Asterisks denote significantly higher (P<0.01) expression of Dbp and Nr1d1 at ZT10 in telogen.

