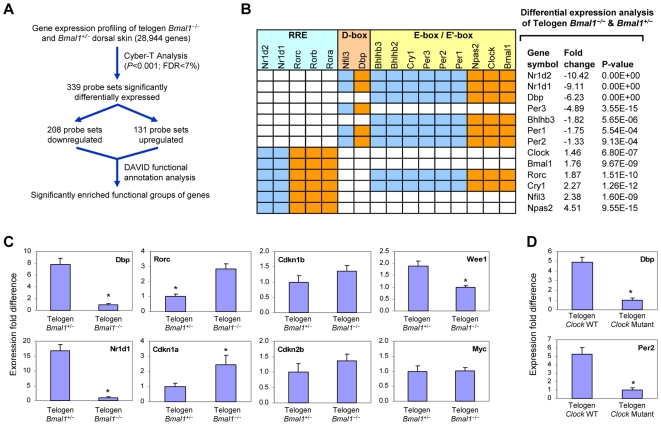
Figure 5. Significant differential expression of circadian transcriptional circuit and key cell cycle regulators in telogen Bmal1 and Clock mutant dorsal skin.
(A) Overview of microarray analysis of P22 Bmal1 −/− and Bmal1 +/− dorsal skin. FDR – false discovery rate. (B) The statistical differential expression of clock genes is shown with the circadian transcriptional circuit, which is represented as a matrix based on the results of Ueda et al. [17]. In the matrix, each column represents a gene encoding a transcription factor (grouped into three classes based on their binding sites: E-box/E′-box, D-box, and RRE), and each row represents a gene that is regulated by these transcription factors. Orange cells denote positive regulation and blue cells denote negative regulation. (C) Q-PCR of CLOCK-regulated genes and key cell cycle regulators in P22 Bmal1 −/− and Bmal1 +/− dorsal skin. (D) Q-PCR of CLOCK-regulated genes in P23 Clock wild-type and Clock mutant dorsal skin. For (C) and (D), expression is normalized to Gapdh and asterisks denote statistically significant (P<0.01) difference in expression between the littermates of the two genotypes. Error bars represent the S.E.M. for independent measurements from five Bmal1 −/− and four Bmal1 +/− mice, and three Clock wild-type and two Clock mutant mice.

