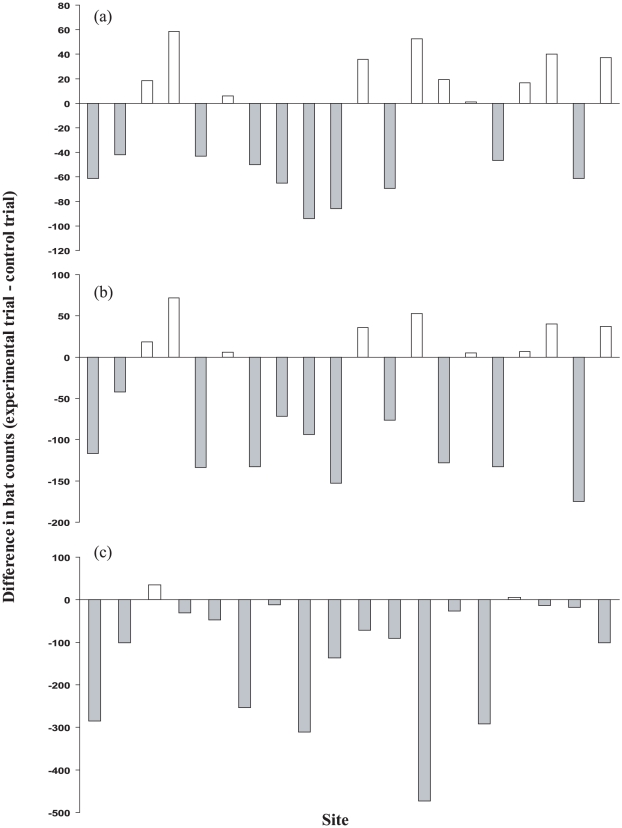
Figure 2. The response of bats to:
(a) short pulse length (0.08 µs) radar signal from a rotating antenna. (b) short pulse length (0.08 µs) signal from a fixed antenna. (c) medium pulse length (0.3 µs) signal from a fixed antenna. Each bar represents the difference in bat counts (the number of times that ultrasound was detected by the automatic bat recording stations) between control and experimental trials. A negative value indicates that bat activity was higher during the control trial than during the experimental trial when the radar was switched on.

