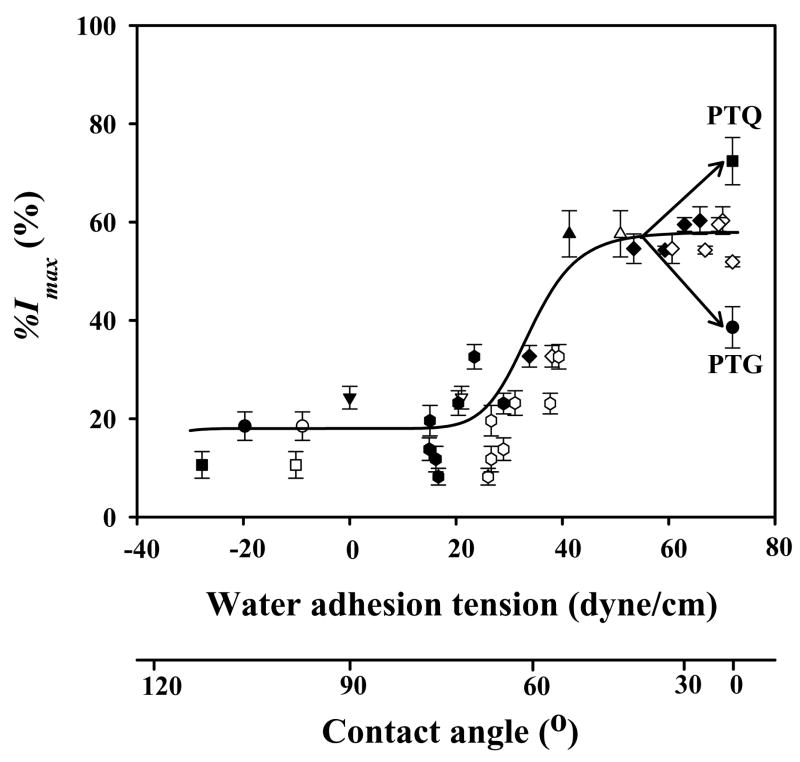
Figure 3.
Correlation of % I max (see Fig. 2) with substrata surface energy for hFOB. Surface energy is here measured by water adhesion tension , where at 20° C for pure water and θ is the angle subtended by a water droplet on the surface understudy (advancing θ = filled symbols, receding θ = open symbols; adapted from ref. [60]). Error bar represents standard deviation (N ≥3). Trend-line through advancing and receding data is guide to the eye; ▲= TCPS; ▼;= BGPS (bacteriological grade polystyrene); ● = glass; ■= quartz; ◆ = PTPS (plasma-treated polystyrene); ⬢ = biodegradable polymers of PLGA 5/5 (Mn = 80 k), PLGA 7/3 (Mn = 96 k), PLA (Mn = 160 k), PCL (Mn = 80 k), PLCL 7/3 (Mn = 82 k), PLGCL 2.5/2.5/5 (Mn = 60 k), PLGCL 3.5/3.5/3 (Mn = 54 k). Mn = number-average molecular weight by GPC. PLGA = poly(lactide-co-glycolide); PLCL = poly(lactide-co-caprolactone); PLGCL = poly(lactide-co-glycolide-co-caprolactone). See ref. [60] for details on materials preparation and characterization.

