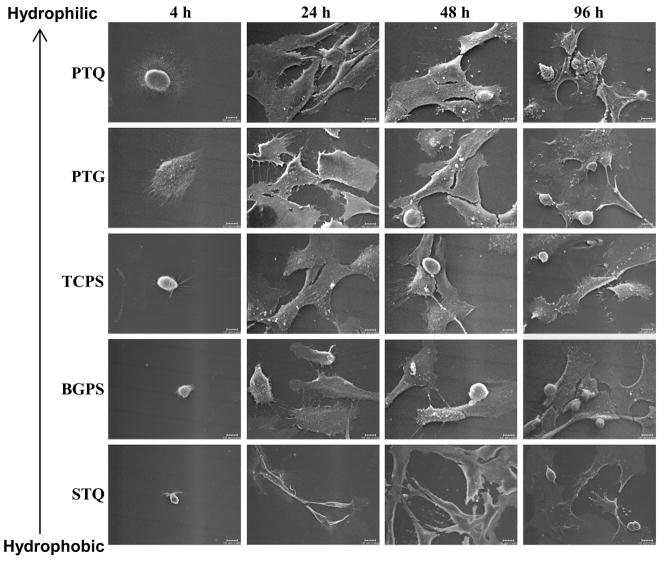
Figure 5.
Variation in hFOB morphology on different surfaces after 4, 24, 48, and 96 hours of culture as assessed by SEM (hydrophilic surfaces: PTQ = plasma-treated quartz, PTG = plasma-treated glass, TCPS = tissue-culture grade polystyrene; hydrophobic surfaces: BGPS = bacteriological grade polystyrene, STQ = silane-treated quartz). Scale bar = 10 μm. Note that variation in cell morphology abates with time, especially for hydrophobic specimens.

