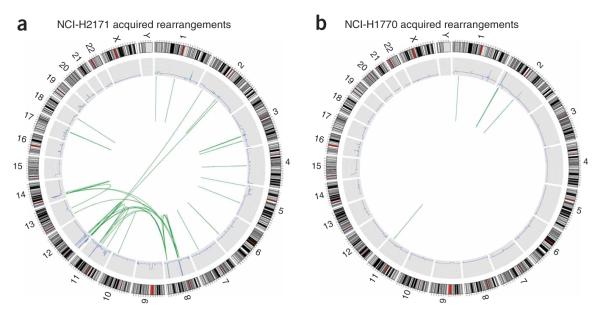
Figure 2.
Genome-wide acquired rearrangements. (a) NCI-H2171. (b) NCI-H1770. The outer ring shows a representation of the normal karyotype (red indicates centromeres). The blue line in the middle ring indicates copy number as determined by short read data. The inner circle shows the two endpoints of each somatic rearrangement identified, joined by green lines. Very small rearrangements appear as single lines.

