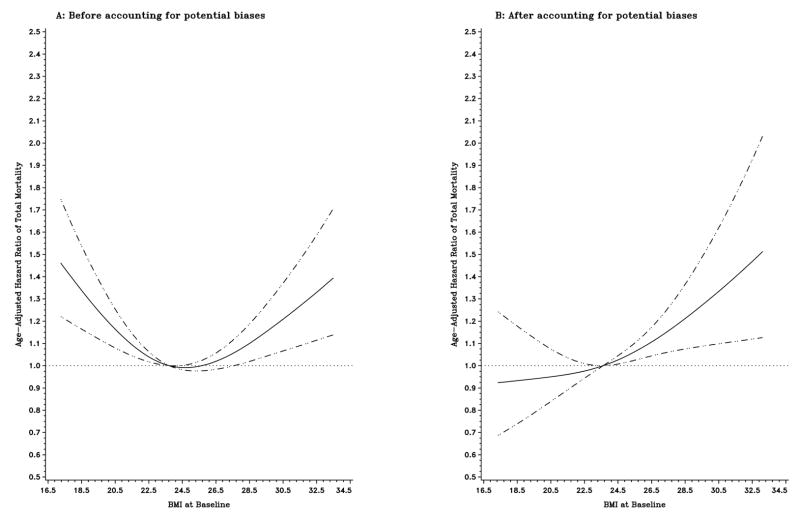
Figure 1.
Title: Age-adjusted hazard ratios of total mortality according to baseline BMI before (A; n=73,403) and after (B; n=62,729) accounting for potential biases. Hazard ratios were estimated from a restricted cubic spline Cox regression model. Point estimates are indicated by a solid line and 95% confidence intervals by dashed lines.

