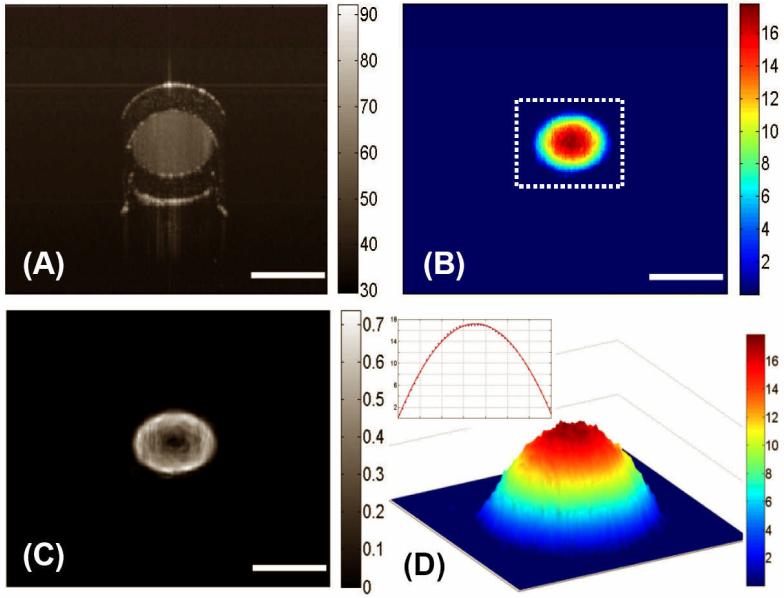
Figure 2.
Typical cross-sectional DOCT images of the flow characteristics in a standard circular plastic tube: (A) the structural image, (B) the flow map, and (C) the corresponding shear stress map. (D) illustrates the 3D flow velocity plot for the area marked by the dashed box in (B) and the inset shows the velocity plot across the channel of the tube, i.e. along a line passing through the center, where it is seen that the flow is parabolic with the maximum in the centre and minimum at the walls. The units for colorbars shown are (A) dB, (B) mm/s, (C) dyn/cm2 and (D) mm/s, respectively. The white bars indicate 700 μm.

