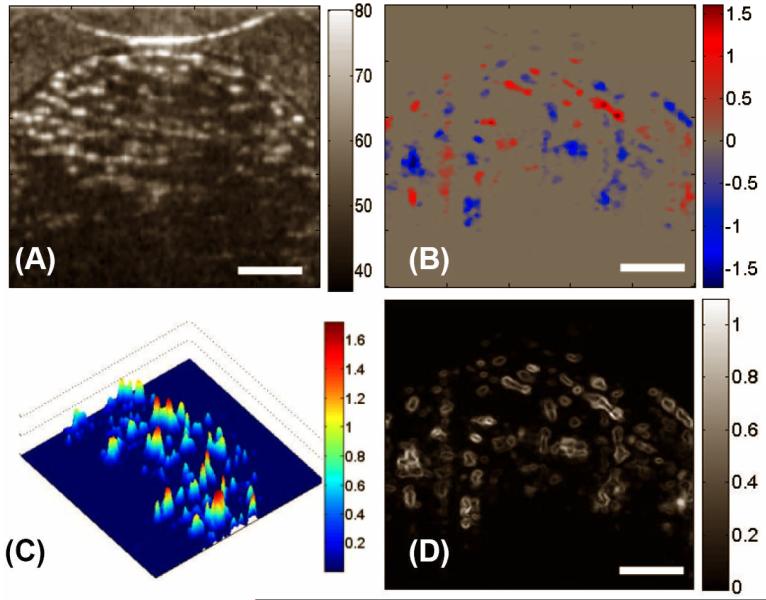
Figure 5.
DOCT monitored the fluid flow in HPCS in situ. Shown are, respectively, (A) the micro-structural image, (B) the bi-directional local fluid flow map, (C) the 3D plot of magnitudes of the flow velocities, and (D) the corresponding local shear stress distribution in a typical X-Z section. The units for colorbars shown are (A) dB, (B) mm/s, (C) dyn/cm2 and (D) mm/s, respectively. The white bars indicate 200μm.

