Figure 8.
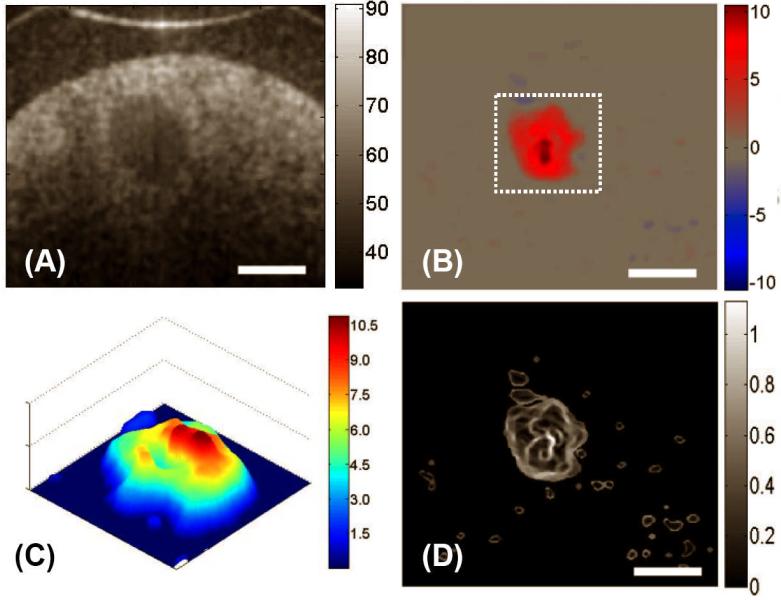
The flow characteristics for a chitosan scaffold with 250 μm central microchannel was measured by DOCT, where (A) the microstructural information and (B) the corresponding fluid flow can be visualized in situ. (C) gives the 3D velocity plot of the region marked with the dashed box in (B), where the flow is non parabolic within the micro-channel. (D) represents the corresponding local shear stress distribution within the cross-section. The units for colorbars shown are (A) dB, (B) mm/s, (C) dyn/cm2 and (D) mm/s, respectively The white bars indicate 200 μm

