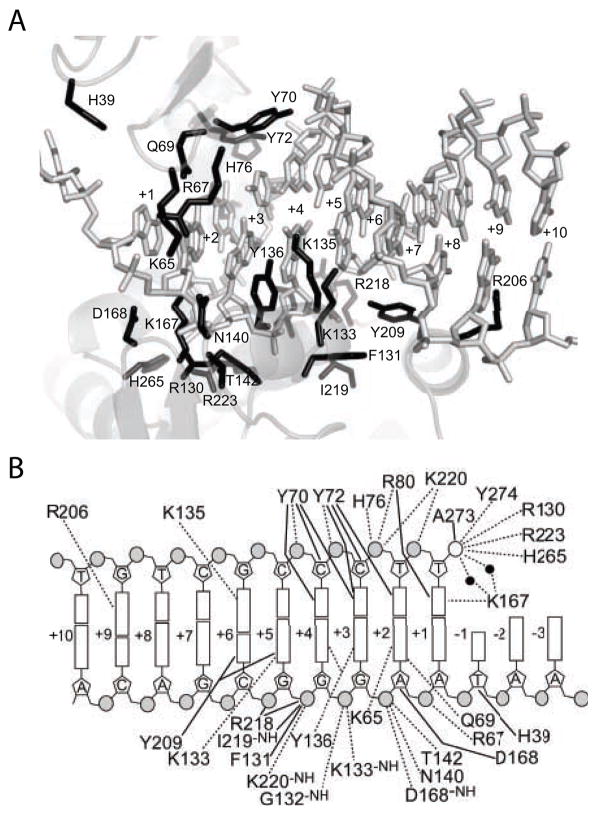
Figure 1.
The variola virus topoisomerase/DNA interface. A) Structure of the topoisomerase/DNA interface. DNA contact residues are shown in black. B) Diagram of the topoisomerase/DNA contacts. Dotted lines indicate hydrogen bonds of less than or equal to 3.3 Angstroms. Solid lines indicate Van der Waals contacts of less than or equal to 4.0 Angstroms.

