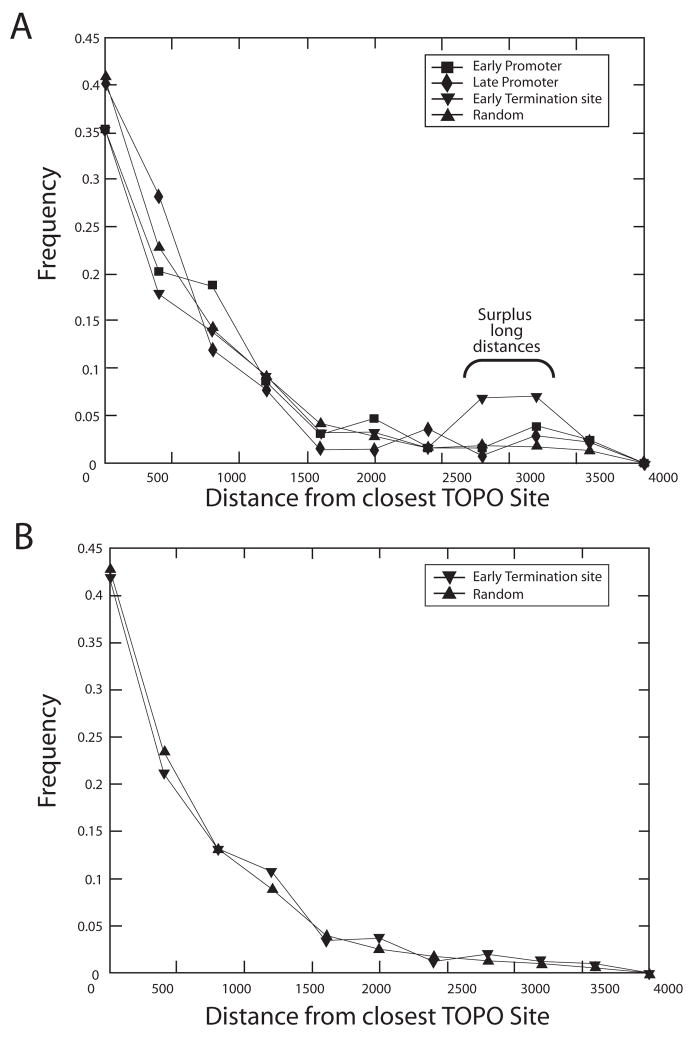
Figure 5.
Frequency histograms analyzing lengths of DNA intervals between predicted topoisomerase sites and predicted early promoters, early terminators, and late promoters in the vaccinia genome (strain Copenhagen). A) The plot shows the distance to the closest topoisomerase site with a match of 0.88 or better. There is no significant favoring or disfavoring of early or late promoters. There is a significant disfavoring of early terminators (P=0.000; Mann-Whitney U test), indicated by the surplus long distances (bracket on the figure). B) The same analysis as above but repeated on vaccinia COP genome with the 20 kb removed from each end. The terminal region is A/T-rich and rich and densely populated with early terminators. Note that the long intervals between early terminators and topoisomerase sites are no longer present, indicating anticorrelation between the two at the genome termini.

