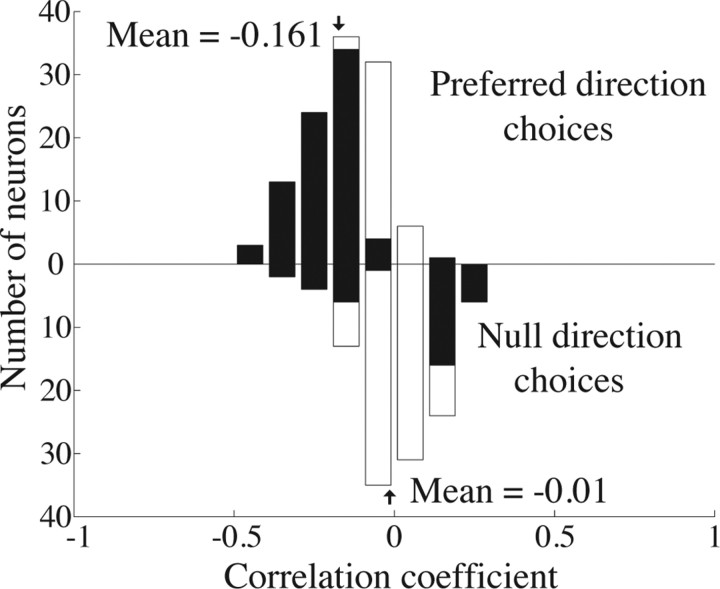
Figure 6.
Frequency histogram of the correlation between firing rate and reaction time for 0% coherence trials in which the monkey reported motion in the preferred (upward bars) and null (downward bars) directions of a neuron. The shaded bars indicate individual experiments for which this correlation was significantly different from 0 (Pearson's correlation, p < 0.05). The mean of the distribution of correlation coefficients for preferred direction choices is significantly <0 (t test, p < 0.001). The mean of the distribution for null direction choices is not significantly different from 0 (t test, p = 0.56).

