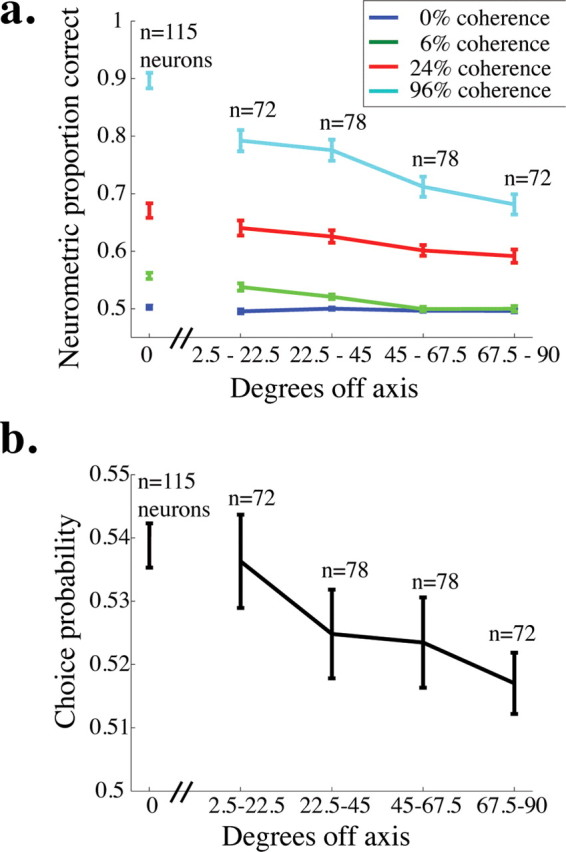
Figure 7.

Neurometric performance and choice probability for off-axis neurons. a, Mean neurometric performance is plotted as a function of the angle between the preferred direction of the neuron and the axis of motion being discriminated for four example coherences. The break in the x-axis after 0° off axis indicates that the data for on-axis neurons were collected in a separate set of experiments from the off-axis neurons (see Materials and Methods). Error bars represent SEM. b, Mean choice probability is plotted as a function of the angle between the preferred direction of the neuron and the axis of motion being discriminated (choice probability was measured for only 0% coherence trials). Conventions as in a.
