
Figure 9.
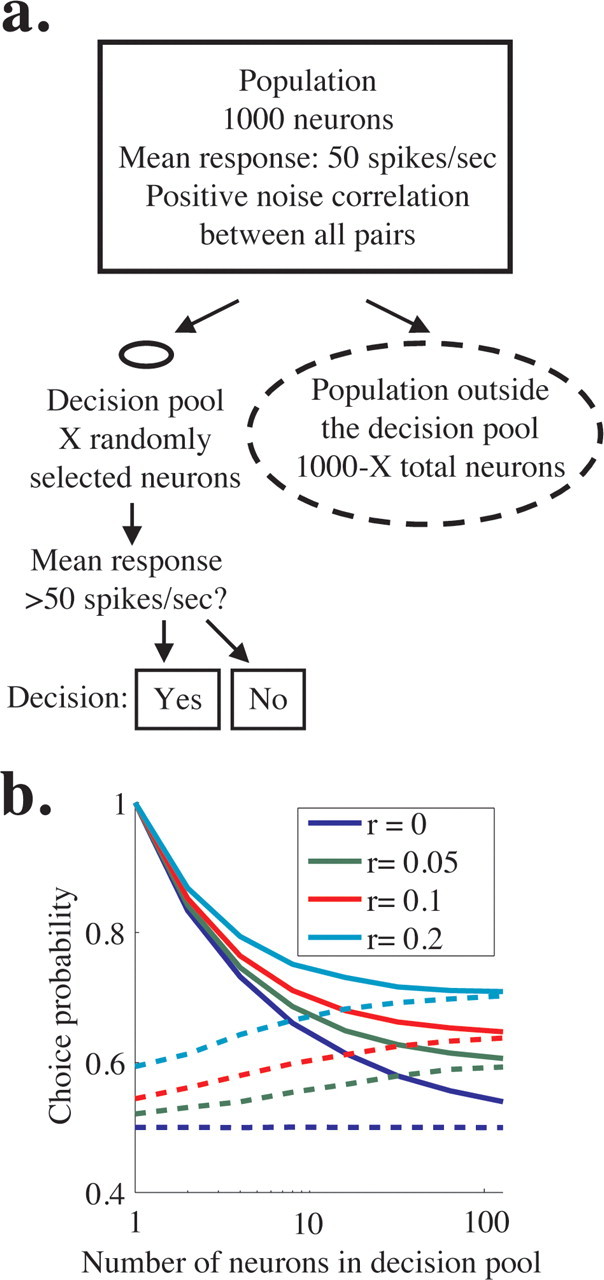
Simulations showing that choice probability is similar for neurons involved and not involved in a decision. a, Schematic of simulations. We simulated the responses of a population of 1000 identically tuned neurons with mean response of 50 spikes/s and constant pairwise noise correlation (rectangle). The decision of the model was based on the responses of a fraction of these neurons that comprised the decision pool (solid oval), and the responses of the rest of the neurons were ignored (dashed lines). The solid oval representing the decision pool is small compared with the dashed oval representing the nondecision pool to represent the relative number of neurons in each. The decision of the model in a hypothetical task was “yes” if the mean activity in the decision pool was >50 spikes/s and “no” otherwise. b, Predicted choice probability for neurons involved (solid lines) and not involved (dashed lines) in a perceptual decision for four uniform levels of noise correlation across the population. Choice probability is plotted as a function of the number of neurons in the decision pool. Choice probability for neurons not involved in the task approaches choice probability for involved neurons for medium to large pool sizes.