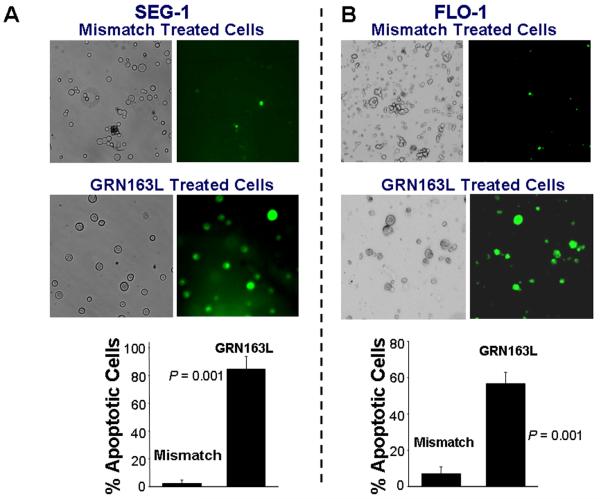
Figure 5. Apoptosis and senescence in adenocarcinoma cells treated with GRN163L.
A – B. Apoptotic cell death in cells treated with GRN163L. The cells treated with control oligonucleotide or GRN163L were harvested, 0.5 ml of cells (1 × 10⁶ cells/ml) were mixed with FITC-annexin and incubated for 15 minutes at room temperature (RT). A portion of cell suspension (50 μl) was placed onto a glass slide, covered with a cover slip and FITC-labeled apoptotic cells within the same microscopic field were viewed and photographed by phase contrast (PC) or by fluorescence emitted at 518 nm (FITC filter). Apoptotic cells appear bright green. (A) SEG-1 cells treated with 2 μM control oligonucleotide or GRN163L for three weeks; (B) FLO-1 cells, treated with 1 μM control oligonucleotide or GRN163L for two weeks. Approximately 200 – 300 cells representing five different microscopic fields were evaluated to assess percentage of apoptotic cells, shown as bar graphs in Panels A and B. C – D. Cells treated with GRN163L were evaluated for expression of β-galactosidase, a marker of cell senescence. C. β-galactosidase staining is shown in SEG-1 cells treated with 2 μM control oligonucleotide (I) or GRN163L (II) for three weeks. Bar graph showing percentage of senescent SEG-1 cells is also shown (III). D. FLO-1 cells treated with 1 μM control oligonucleotide (I) or GRN163L (II) for two weeks. Cells with typical senescent morphology in C and D are shown with arrows.


