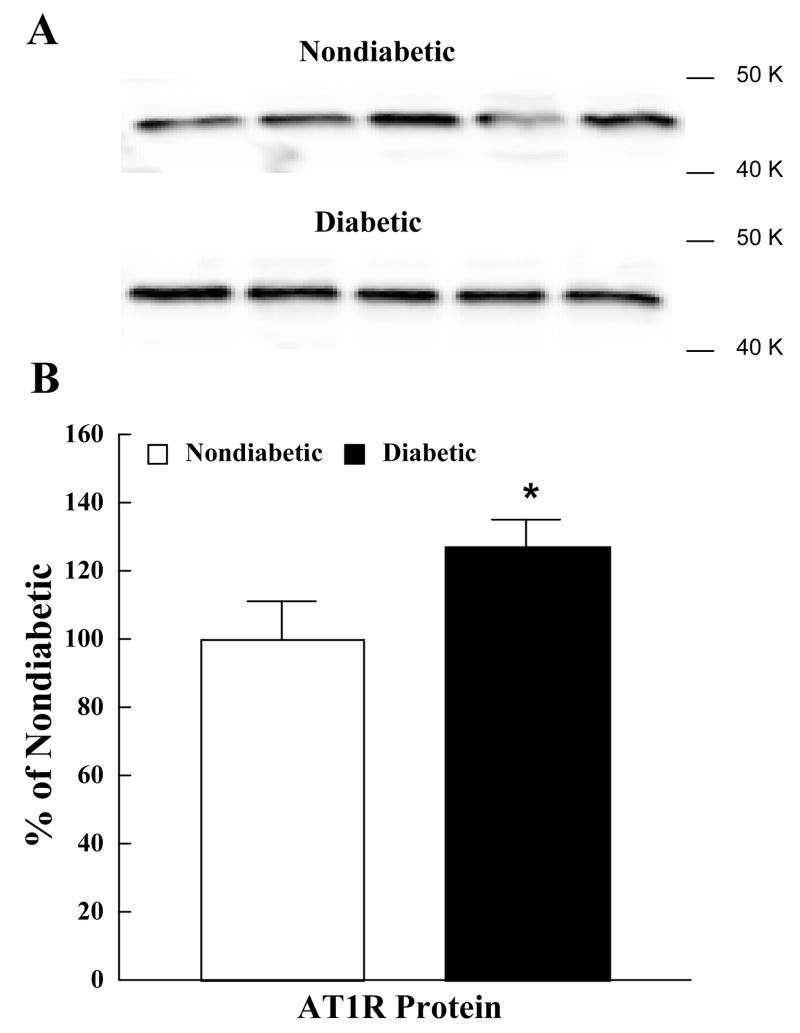
Figure 6.
AT1R protein in cerebral microvessels obtained from nondiabetic and diabetic rats. The upper panel shows Western immunoblot of AT1R protein in cerebral cortex microvessels (upper lanes are microvessels from nondiabetic rats and lower lanes are microvessels from diabetic rats). The lower panel shows the quantified data for AT1R protein in nondiabetic (open bars) and diabetic (closed bars) rats. Optical density of AT1R protein positive bands was quantified by scanning densitometry and plotted relative to nondiabetic rats. Values are means ± SE. *p<0.05 versus nondiabetic rats.

