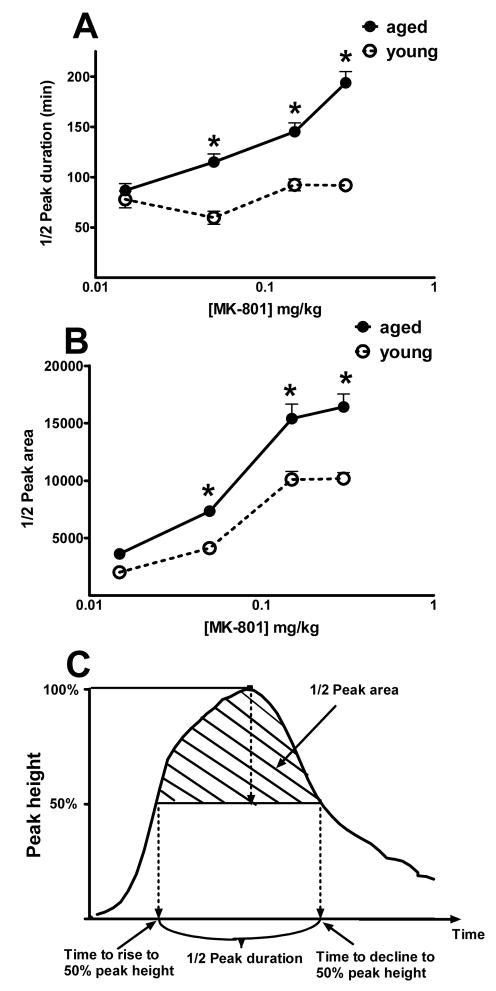
Fig. 3.
Properties of the MK-801-induced hyperlocomotion peak in the aged and the young mice. MK-801 dosing is shown in log scale. Filled symbols with solid lines: aged mice; open symbols with dotted lines: young mice. (A) Half-peak duration is the time span between the rising phase half-peak point and the declining phase half-peak point. * P < 0.05, significant difference (F(1,86)=48.05) (B) Half-peak area is the area for the top half of the hyperlocomotion peak. * P < 0.05, significant difference (F(1,68)=58.75). (C) Diagram showing how the two parameters in (A) and (B) were calculated.

