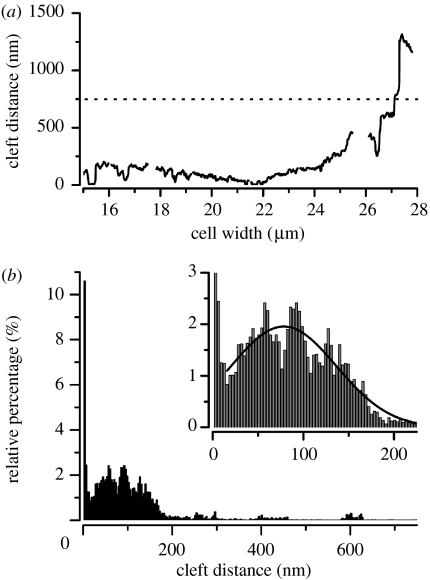
Figure 7.
(a) This diagram shows the cleft distance dj of the TEM image in figure 5a in dependence on the cell width. We could clearly distinguish between close adhesion of the membranes with dj≤10 nm, enhanced distances of dj=100–150 nm and distances dj≥500 nm at the border of cell–substrate interface. The intersections in the trace correspond to the gaps in the sputtered layer (white gaps in figure 5a,b). (b) Distance distribution for the cell–surface distance of the cell shown in figure 5a. We neglected distance values of dj≥750 nm (dotted line in (a)) as we found them only at the borders of cell–substrate interface. The inset shows a part of the histogram at higher magnification. We fitted the data to a Gaussian distribution (inset, black curve) and obtained an average cleft distance of .

