
Figure 2. Kinetics of the inflammatory response following infection of the CNS.
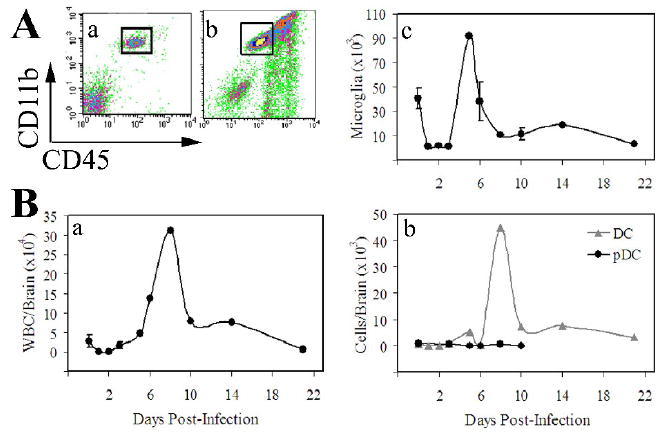
Mice were administered a single intranasal dose of VSV at the indicated times prior to euthanasia. Brains were excised, homogenized and the leukocyte fraction enriched by discontinuous Percoll gradient centrifugation. Cells were stained with the indicated mAbs and phenotyped by multiparameter flow cytometry. (A) Microglia isolated from mock (a) and VSV infected (b) brains were gated as CD11b+CD45low/int (box) and the absolute number of microglia calculated at each of the indicated time points (c). (B) A similar calculation to determine absolute numbers/brain was performed for infiltrating blood-derived leukocytes identified as CD45high cells (a). The absolute numbers of conventional (CD45highCD11c+PDCA-1-) and pDCs (CD45highCD11c+PDCA-1+) per brain were similarly determined (b). The values presented represent the mean ± S.E.M. cell yields from the pooled brains of 3-5 mice and 2-9 experiments per time point. Absolute numbers were calculated based on cell recoveries in each organ and the percentage of microglia at each of the indicated time points. Note that the scales in Figure 2B (panels a and b) are different.