
Figure 3. Kinetics of T cell subset infiltration in the encephalitic brain.
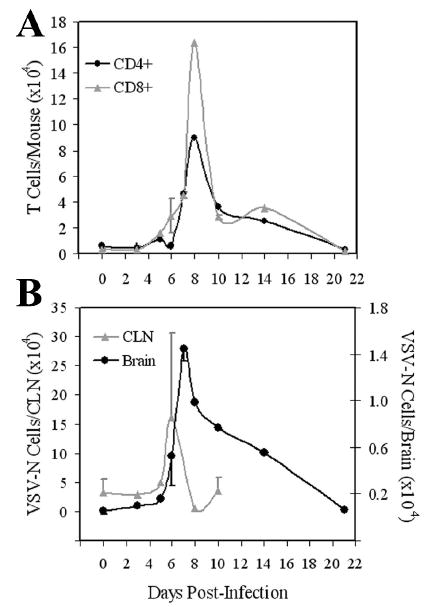
Mice were infected with VSV and at the indicated times post infection, brains were excised, pooled and leukocytes isolated by Percol gradient centrifugation. Single cell suspensions of pooled cervical lymph nodes (CLNs) were also prepared from the same animals. Cell populations were then phenotyped by flow cytometry. (A) Leukocytes infiltrating the brain were stained with mAbs to either CD8 or CD4 and the number of each T cell subset per brain calculated based on cell recoveries and percentage of each subset. (B) Cells were incubated with tetramers, washed and then stained with mAb to CD8. The absolute number of CD8+ VSV-N T cells present in the brain and CLN was then calculated based on the cell recoveries in each organ and percentage of CD8+tetramer+ cells. These values represent the means ± SEM of 2-8 experiments with 3-5 mice per time point.