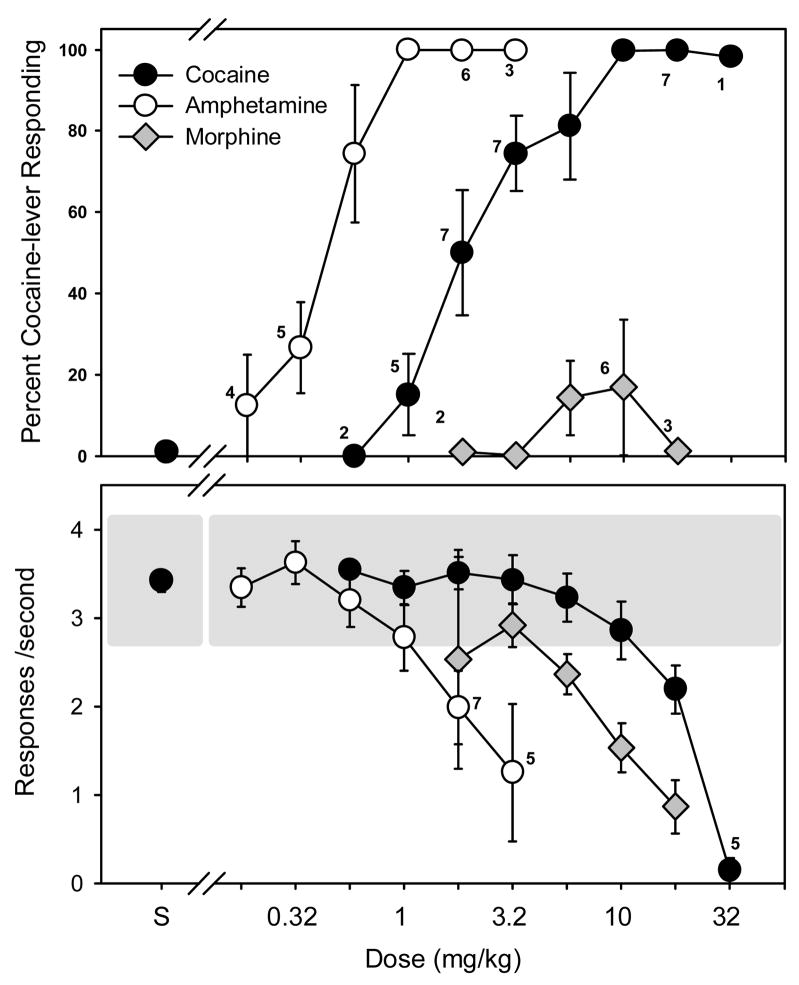
Figure 1.
Percentage of cocaine-lever responding (upper panel) and overall rate of responding (lower panel) in subjects administered either cocaine (n=8, filled circles), amphetamine (n=7, unfilled circles) or morphine (n=7, grey diamonds). All three drugs were administered i.p. immediately before the start of the session. Values adjacent to a data point indicate the number of subjects represented by that point, if less than 8 for cocaine, or 7 for amphetamine and morphine. Percentages of cocaine-lever responding and response rates are expressed as mean ± S.E.M. The shaded area on the bottom panel represents the mean response rate following saline administration ± 20 %.

