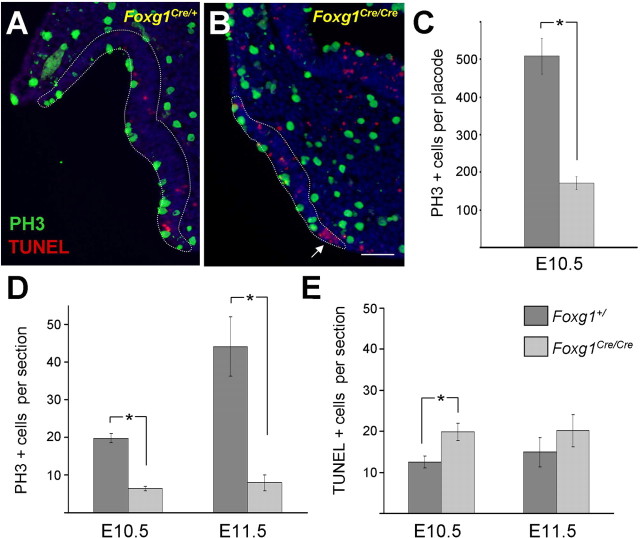
Figure 5.
Temporal analysis of proliferation and apoptosis in the mouse olfactory placode. PH3 (green) and TUNEL (red) were used to identify proliferating and apoptotic cells, respectively. Representative transverse sections are shown from a control E10.5 embryo (A) and Foxg1Cre/Cre (B). Olfactory epithelium borders are indicated by dashed white lines. C, Wild-type mice have threefold more proliferating cells per placode than Foxg1 mutants (p = 0.001, Student's t test; n = 4 wild-type placodes, n = 3 mutant placodes). D, Quantitation of PH3-positive cells per section shows that mitotic cells increase with time in wild-type mice, whereas mice lacking functional Foxg1 fail to expand the pool of proliferative cells. There is a threefold difference in the number of proliferating cells at E10.5 (p = 5 × 10⁻⁶; n = 6 wild-type, 5 mutant mice) and 5.5-fold difference at E11.5 (p = 4 × 10⁻⁴; n = 5 wild-type, 7 mutant mice). E, Foxg1 homozygous null mice show a small but significant increase in cell death at E10.5 (p = 0.009; n = 6 wild-type, 5 mutant mice), although the increase at E11.5 is not significant (p = 0.4; n = 5 wild-type, 7 mutant mice). A subsequent wave of apoptosis was observed at E12.5 (Fig. S2, available at www.jneurosci.org as supplemental material). Asterisks indicate statistical significance as noted above. Scale bar, 100 μm.

