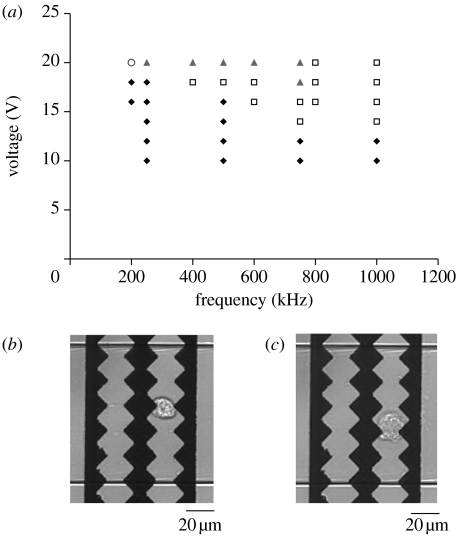
Figure 2.
(a) Graph showing regions of dielectrophoretic trapping (squares), trapping and lysis (triangles), immediate lysis (circle) and unperturbed cell flow (diamonds) in the frequency–voltage plane. (b) A cell trapped between the electrodes by DEP at 1 MHz and 18 Vpp. (c) A cell burst after trapping at 1 MHz and 20 Vpp followed by electroporation and lysis at 500 kHz and 20 Vpp.

