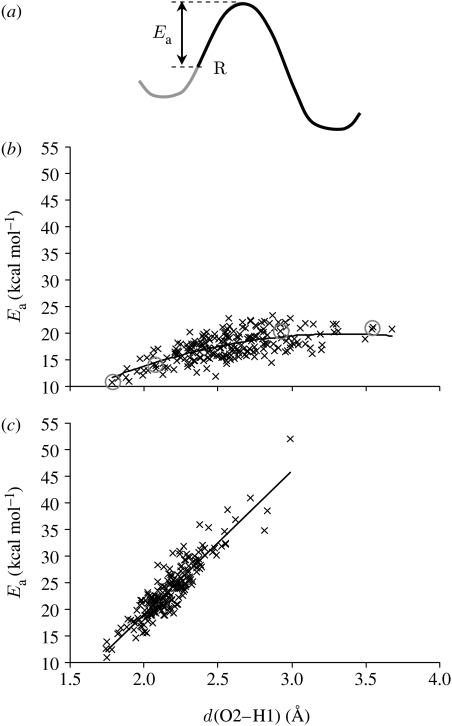
Figure 2.
(a) Illustration of idiosyncratic activation energy (Ea) used in the analysis, defined as the height from the reactant (R), i.e. the MD snapshot, to the top of the PES; (b,c) activation energy for proton transfer versus d(O2–H1) for the α2β2-heterotetramer and the β-monomer, respectively. The grey circles indicate the potential energy profiles shown in figure 3.

