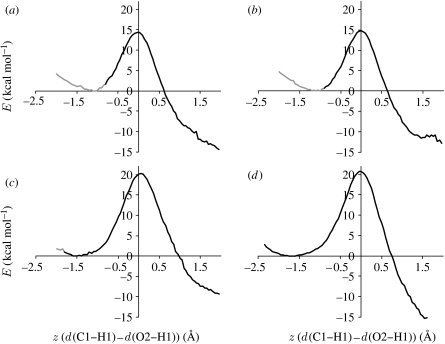
Figure 3.
Example potential energy profiles for proton transfer in the α2β2-heterotetramer with the z-value of the MD snapshot (a) more positive, (b) similar and (c,d) more negative than the minimum on the reactant side. The black and grey lines represent the potential energy as z increases and z decreases, respectively, from the MD snapshot. The d(O2–H1) distances in the reactant structures are (a) 1.78 Å, (b) 2.07 Å, (c) 2.92 Å and (d) 3.54 Å.

