Abstract
In cardiovascular CT, thin collimation results in a large number of images per examination. Moreover, interpretation relies on multiplanar reformatted images. While many strategies for approaching cardiac reformations have been described, as CT utilization increases, so does the importance of simple and reproducible post-processing algorithms. The clinical importance of reformations has recently extended beyond the left ventricle to include the right ventricular in patients with pulmonary embolism (PE). This work illustrates an algorithm to reformat two of the most important views in cardiovascular CT: the 4-chamber and short axis views. The illustration is performed in the context of two cardiovascular examinations: cardiac CT and CT pulmonary angiography (CTPA).
Indexing Key Words: Image Processing, Computed Tomography Angiography, Cardiovascular, Pulmonary Embolism
Introduction
Utilization of MDCT for cardiovascular applications continues to increase. Robust ECG gated protocols are being used with increased frequency for assessment of coronary stenoses, so called “coronary CTA.” Because CT is acquired throughout the R-R interval, the size and function of the left ventricle (LV) can be evaluated with reformatted images viewed as a cine loop throughout the cardiac cycle(1, 2). The evaluation of pulmonary embolism (PE) represents another important use of CTA in CV imaging. In addition to the fact that CTA is a primary method to diagnose PE, recent work suggests that prognostic information can be obtained by evaluating the size of the right ventricle (RV)(3–5). The use of multiplanar reformatted images to assess the size of the RV has been proposed as a tool to help determine patient prognosis(6, 7).
With respect to image acquisition and reconstruction, thin collimation is a common theme for both coronary CTA and CT pulmonary angiography (CTPA). The resulting thin axial slices serve as the primary data set from which reformatted views are obtained, despite the fact that the contrast-enhanced CT protocol for the detection of PE and the evaluation of coronary stenosis differ with regard to many factors including the contrast bolus timing, the use of ECG gating, the volume of contrast material, and the detector collimation. The details of the image acquisition for each specific vendor are beyond the scope of this work, but as an example, at our institution ECG-gated coronary CTA is performed using a 64-slice system with 0.6 mm detector collimation. The axial slices for evaluation of the coronary arterial tree have a reconstruction interval of 0.4 mm. To assess the left ventricle, additional 2mm thick images are reconstructed over ten equally spaced phases (0–90%) in the cardiac cycle. Additional phases (e.g. 20 reconstructions at 5% intervals) could be performed and may be important in newer generation CT systems with temporal resolutions under 100 milliseconds. In our experience, the 2 mm thick images give good signal and do not overwhelm the 3D image post-processing hardware/software. For each patient, the 4-chamber and short axis views are reformatted. The short axis view is used to compute left ventricular ejection fraction (8), and a cine of the ten phases of the 4-chamber view is used as an overview (with short axis views) for ventricular global and regional wall motion(1). It is important to note that additional cardiac axes can be used to depict specific pathology, e.g. the 3-chamber view for evaluating mitral valve prolapse(9), but the present article is designed to give the radiologist who is just beginning the practice of cardiovascular CT a primer for those images that are required in a complete evaluation in every patient.
At our institution CTPA imaging is performed with a 16-slice or a 64-slice scanner with 0.6 – 0.75 mm detector collimation; the axial images are reconstructed at 1.0 or 1.25 mm increments. ECG gating is not used(10). For every patient who has PE, the 1.25 mm images are reformatted into a 4-chamber view, and the ratio of the right ventricular to left ventricular diameter is reported.
The two CT protocols have two common themes related but not specific to CV imaging. Since the introduction of 4-slice CT, larger and larger data sets have been obtained secondary to large volume imaging and thin collimation. It is also important to emphasize that the 4-chamber and short axis views are essential components of image interpretation. Thus, the effectiveness of cardiovascular CT, in part, depends on the ability of both new and experienced imagers to rapidly reformat standard, reproducible views.
The 4-chamber view is aligned along the intrinsic axes of the heart, and thus provides a more precise anatomical representation than views based on the axial, coronal, and sagittal axes of the body(11). While radiology trainees (and practicing radiologists) are becoming increasingly familiar with image post-processing software, many are less familiar with the steps required to create an accurate and reliable 4-chamber view. Thus, inter-observer variability is not surprising when reformatting is performed by imagers relatively new to cardiovascular CT. The short axis views of the heart are orthogonal to the 4-chamber view and are the primary projection to calculate ventricular volumes, and thus ventricular ejection fraction. Image reformation of these views is well-described and analyzed in the CT(12, 13) and MR(14) literature, although typically in the context of evaluating the LV in patients with atherosclerotic heart disease. The purpose of this article is to illustrate, using clear anatomic landmarks, a simple and reproducible method to create the 4-chamber and short axis views. The algorithm has three primary steps based on LV landmarks. After the third step, a fourth step can be performed to assess the full extent of the right ventricle for patients who have acute PE. In these patients, visualization of the entire right ventricular cavity can be useful in comparing with the left ventricle. The algorithm is described generally so that the reader can perform the steps with any image post-processing workstation.
In step one, the cardiac apex is identified. In step two, using true sagittal images, a line between the apex and the midpoint of the mitral valve is drawn to define the 4-chamber view. The 4-chamber view obtained from this step is analogous to the projection used to evaluate the left ventricle in echocardiography and cardiac magnetic resonance imaging (11). In step three, using the image derived from step two, a second line between the mitral valve and apex is drawn to show the short axis view. The fourth step uses images derived from step three to evaluate the right ventricle.
Algorithm
In step 1, the cardiac apex is identified. After windowing and leveling the data to allow for identification of the ventricular walls and the valve planes, the cardiac apex is marked with a cross-hair on the image post-processing tool in the true axial, sagittal, and coronal planes (Figure 1). It is essential to accurately identify landmarks such as the apex, a focal point for the reformations. Misidentification will lead to off axis views and inaccurate measurements.
Fig. 1.

True axial, coronal and sagittal views of the cardiac apex. The first step is identifying the cardiac apex on the standard axial (left), coronal (middle), and sagittal (right) views, and marking the apex with the cross-hair.
In step 2, a line is drawn from the cardiac apex to the midpoint of the mitral valve, using true sagittal reformatted images exclusively. With the apex marked, the mitral valve can be identified by scrolling through the sagittal images from the patient’s left towards the midline. Because of its orientation in the sagittal plane, the mitral valve will be seen on several consecutive images (Figure 2). Ideally, the center of the mitral valve will be located on a sagittal slice in which the left ventricle appears crescentic. However, for an individual patient, the left ventricle may not be symmetrically crescentic on the best slice. With the cross hairs fixed on the apex, one of the lines is rotated until it crosses the center of the mitral valve (Figures 3 and 4). The plane defined by this line is the 4-chamber view routinely used in echocardiography and cardiac magnetic resonance to evaluate the left ventricle (Figure 5).
Fig. 2.
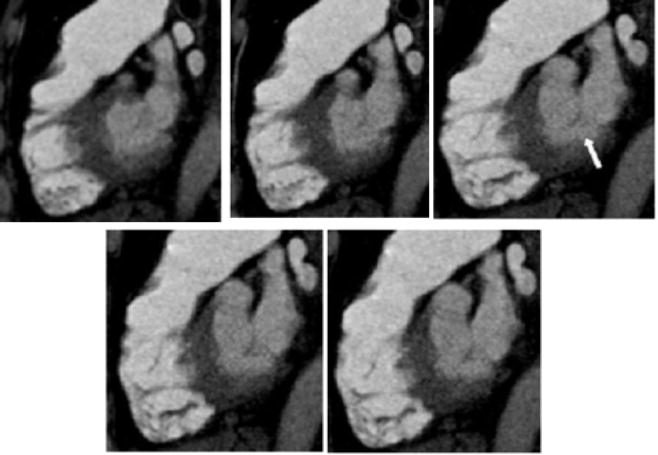
Five consecutive 1.25mm thick sagittal images though the mitral valve (white arrow). The valve plane is seen on several images.
Fig. 3.
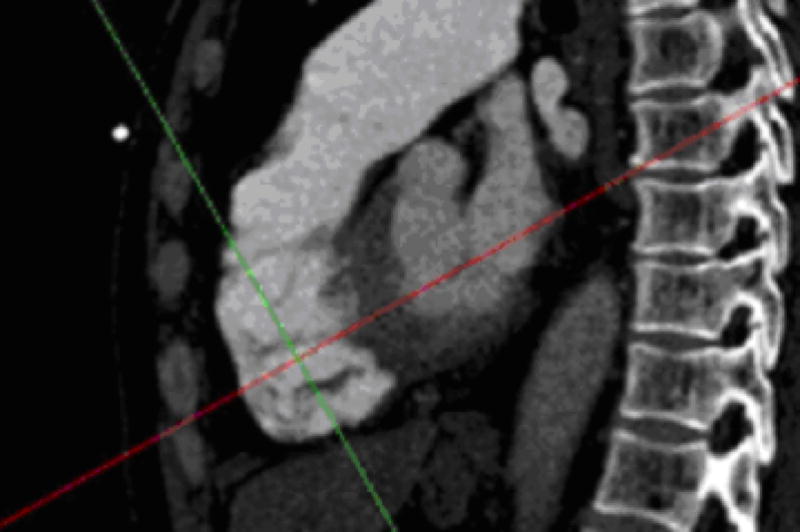
The chosen sagittal image with one line (red) of the cross hair positioned through the center of the mitral valve. Note that when the sagittal images are scrolled to visualize the mitral valve, the cross hair remains in the same plane as the apex (as defined in Step 1) and typically is seen within the right ventricular cavity.
Fig. 4.
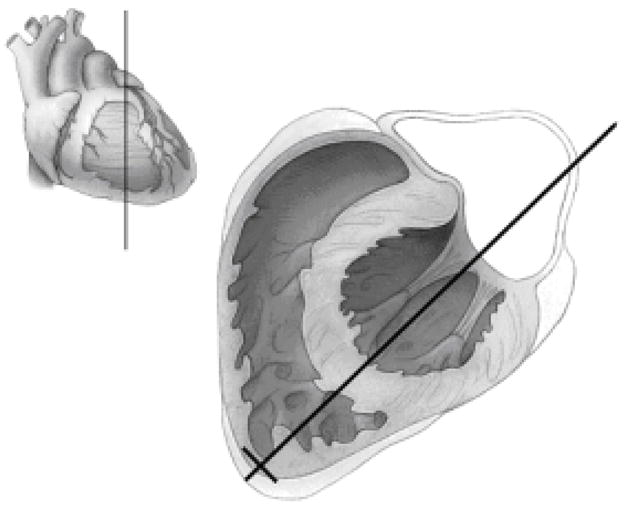
Illustration of Step 2. The long black line from the cardiac apex through the mitral valve defines the plane of a 4-chamber view. The volume sketch in the upper left-hand corner shows the plane of the main illustration in relation to the surface of the heart.
Fig. 5.
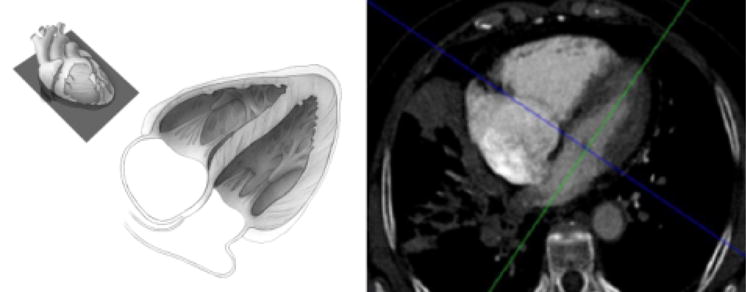
Four-chamber view. This view is used to evaluate left ventricular wall motion abnormalities. The anatomic plane of the 4-chamber view is shown in the top left hand corner. The larger illustration (middle) shows the orientation of the cardiac chambers. When CT images are viewed in this plane as a cine loop, left ventricular wall motion can be assessed. The corresponding patient image (right) shows the cross hairs in the center of the mitral valve; this is the basis of Step 3 in which the short axis views are created.
In step 3, the orientation of the short axis “stack” of images is defined by centering the cross-hair in the mitral valve (Figure 5) and bisecting the left ventricle. The short axis stack is the set of images orthogonal to this line (Figure 6); these images are used to evaluate left ventricular volumes.
Fig. 6.
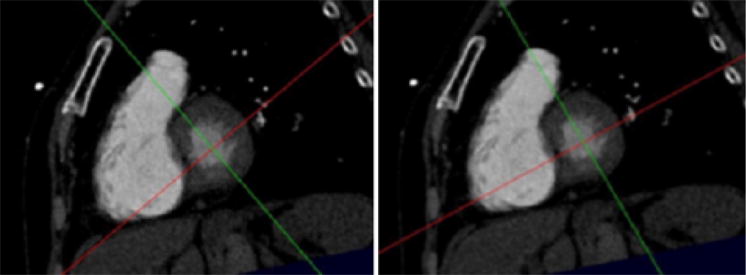
Short-axis view at the base of the heart. Scrolling the images in this plane will give the short axis stack to be used to calculate left ventricular volumes. The left hand image shows the orientation of the cross hairs at the end of Step 3, namely after the creation of the short axis stack. As noted in the description of Step 4, a 4-chamber view aligned along the plane defined by the red line will not demonstrate the maximum diameter of the right ventricle. In the right hand image (Step 4) the red line has been turned so that the 4-chamber plane it defines includes the full extent of the right ventricle.
As noted earlier, steps 1 through 3 are based solely on left heart landmarks, and these maneuvers will yield reliable, reproducible imaging of the left ventricle. There is a growing potential role for CT in the assessment of the right ventricle after pulmonary embolism. The parameter most widely studied is the ratio of the right over left ventricular diameter ratio measured on the 4-chamber view. As noted in the discussion, a potential pitfall in this method is variability in the right ventricular size on the 4-chamber view. For patients diagnosed with pulmonary embolism, step 4 represents a systematic approach for determining the maximum diameter of the right ventricle.
On the workstation, the user identifies the entire curvature of the right ventricular free wall by scrolling through (from mitral valve to apex) the short axis images. It is important to view the entire set of short axis images, because the image chosen for Step 4 should be the image with the largest right ventricular size (as measured from the center of the left ventricle). On this image, with the cross-hairs in the center of the left ventricle, the line should be “turned” to intersect the point of the free wall of the right ventricle with maximum curvature (Figures 6 and 7). This point is the location on the right ventricle free wall that is farthest from the center of the left ventricle. The line that is “turned” defines the 4-chamber view that demonstrates the maximum diameter of the right ventricle (Figure 8).
Fig. 7.
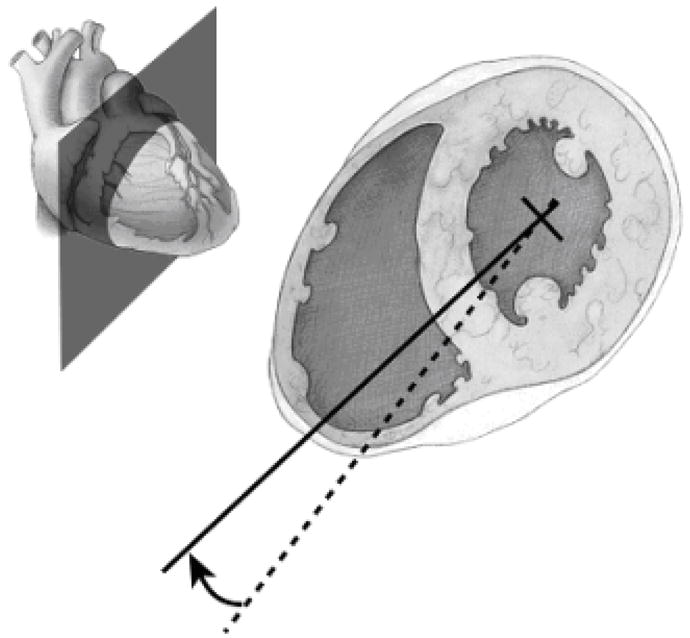
Illustration of the “turn” used to optimally visualize the right ventricle. A dashed line was the result of Step 3, the creation of the short axis stack. The dashed line defined a plane through the right ventricle, but this plane does not fully represent the size of the right ventricle. This can cause an underestimation of the right ventricular diameter on 4-chamber views. In Step 4, the dashed line is “turned” to the solid line, with the center point (cross-hairs) rotating through the center of the left ventricle. The plane defined by the solid line characterizes the full diameter of the right ventricle. The upper left-hand corner shows the plane illustrated with respect to the surface of the heart.
Fig. 8.
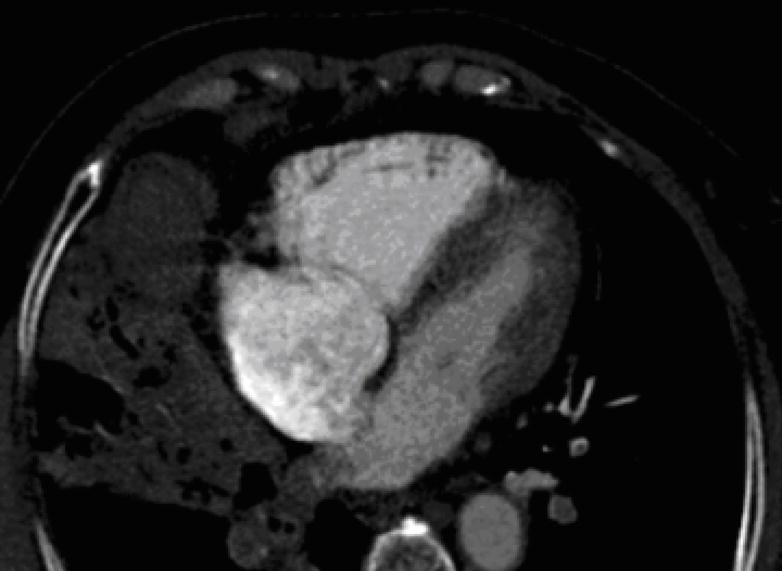
4-chamber view after Step 4 (see text for details) that demonstrates the full extent of the right ventricular chamber size.
Discussion
While there are many clinical indications in cardiovascular CT, this article uses the thin slices generated by coronary CTA and CTPA to illustrate post-processing fundamentals that can be used to evaluate both ventricles. While many descriptions of post-processing strategies are outlined in the literature(1, 2, 12, 13) standardized algorithms for both coronary CTA and CTPA image reformations are becoming increasingly important as the volume of cardiovascular imaging and the expectations from referring physicians continues to increase. Assessment of regional and global left ventricular function by wall motion abnormalities and left ventricular ejection fraction are important parameters that can reflect the severity of cardiac diseases. Thus, it is important to make accurate 4-chamber and short axis views. In our experience with trainees, working with an institutional standard in image post-processing is critical for reproducibility and providing a method for rapid training and correction of errors among more junior radiologists.
With respect to risk stratification after pulmonary embolism, recent literature suggests that measurements derived from 4-chamber reformatted images may be used(6, 7). However, accuracy is highly dependent on measurement reproducibility. As there is more than one method to arrive at an image that demonstrates all four cardiac chambers, these methods have the potential to yield highly variable results. This article shows a method based solely on left ventricular landmarks plus an additional step to maximize the size of the right ventricle. It is hoped that a common method of measurement can be adopted to avoid ambiguity both in research and in clinical practice.
Footnotes
Publisher's Disclaimer: This is a PDF file of an unedited manuscript that has been accepted for publication. As a service to our customers we are providing this early version of the manuscript. The manuscript will undergo copyediting, typesetting, and review of the resulting proof before it is published in its final citable form. Please note that during the production process errors may be discovered which could affect the content, and all legal disclaimers that apply to the journal pertain.
References
- 1.Juergens KU, Grude M, Fallenberg EM, et al. Using ECG-gated multidetector CT to evaluate global left ventricular myocardial function in patients with coronary artery disease. AJR Am J Roentgenol. 2002;179:1545–1550. doi: 10.2214/ajr.179.6.1791545. [DOI] [PubMed] [Google Scholar]
- 2.Juergens KU, Fischbach R. Left ventricular function studied with MDCT. Eur Radiol. 2006;16:342–357. doi: 10.1007/s00330-005-2888-5. [DOI] [PubMed] [Google Scholar]
- 3.Ghaye B, Ghuysen A, Willems V, et al. Severe pulmonary embolism: pulmonary artery clot load scores and cardiovascular parameters as predictors of mortality. Radiology. 2006;239:884–891. doi: 10.1148/radiol.2392050075. [DOI] [PubMed] [Google Scholar]
- 4.Ghaye B, Ghuysen A, Bruyere PJ, D’Orio V, Dondelinger RF. Can CT pulmonary angiography allow assessment of severity and prognosis in patients presenting with pulmonary embolism? What the radiologist needs to know. Radiographics. 2006;26:23–39. doi: 10.1148/rg.261055062. discussion 39–40. [DOI] [PubMed] [Google Scholar]
- 5.van der Meer RW, Pattynama PM, van Strijen MJ, et al. Right ventricular dysfunction and pulmonary obstruction index at helical CT: prediction of clinical outcome during 3-month follow-up in patients with acute pulmonary embolism. Radiology. 2005;235:798–803. doi: 10.1148/radiol.2353040593. [DOI] [PubMed] [Google Scholar]
- 6.Schoepf UJ, Kucher N, Kipfmueller F, Quiroz R, Costello P, Goldhaber SZ. Right ventricular enlargement on chest computed tomography: a predictor of early death in acute pulmonary embolism. Circulation. 2004;110:3276–3280. doi: 10.1161/01.CIR.0000147612.59751.4C. [DOI] [PubMed] [Google Scholar]
- 7.Quiroz R, Kucher N, Schoepf UJ, et al. Right ventricular enlargement on chest computed tomography: prognostic role in acute pulmonary embolism. Circulation. 2004;109:2401–2404. doi: 10.1161/01.CIR.0000129302.90476.BC. [DOI] [PubMed] [Google Scholar]
- 8.Messroghli DR, Bainbridge GJ, Alfakih K, et al. Assessment of regional left ventricular function: accuracy and reproducibility of positioning standard short-axis sections in cardiac MR imaging. Radiology. 2005;235:229–236. doi: 10.1148/radiol.2351040249. [DOI] [PubMed] [Google Scholar]
- 9.Cerqueira MD, Weissman NJ, Dilsizian V, et al. Standardized myocardial segmentation and nomenclature for tomographic imaging of the heart: a statement for healthcare professionals from the Cardiac Imaging Committee of the Council on Clinical Cardiology of the American Heart Association. Circulation. 2002;105:539–542. doi: 10.1161/hc0402.102975. [DOI] [PubMed] [Google Scholar]
- 10.Schoepf UJ, Costello P. CT angiography for diagnosis of pulmonary embolism: state of the art. Radiology. 2004;230:329–337. doi: 10.1148/radiol.2302021489. [DOI] [PubMed] [Google Scholar]
- 11.Boxt LM. Cardiac MR imaging: a guide for the beginner. Radiographics. 1999;19:1009–1025. doi: 10.1148/radiographics.19.4.g99jl161009. discussion 1026–1008. [DOI] [PubMed] [Google Scholar]
- 12.Mahnken AH, Henschmi M, Ruettner A. Functional cardiac imaging. In: Bruening R, Kuettner A, Flohr T, editors. Protocols formultislice CT. 2. Berlin, Germany: Springer-Verlag; 2006. pp. 173–175. [Google Scholar]
- 13.de Feyter PJ, Krestin GP. Assessment of left ventricular function. Computed tomography of the coronary arteries. London: Taylor and Francis; 2005. pp. 153–156. [Google Scholar]
- 14.van der Vleuten PA, Willems TP, Gotte MJ, et al. Quantification of global left ventricular function: comparison of multidetector computed tomography and magnetic resonance imaging. a meta-analysis and review of the current literature. Acta Radiol. 2006;47:1049–1057. doi: 10.1080/02841850600977760. [DOI] [PubMed] [Google Scholar]


