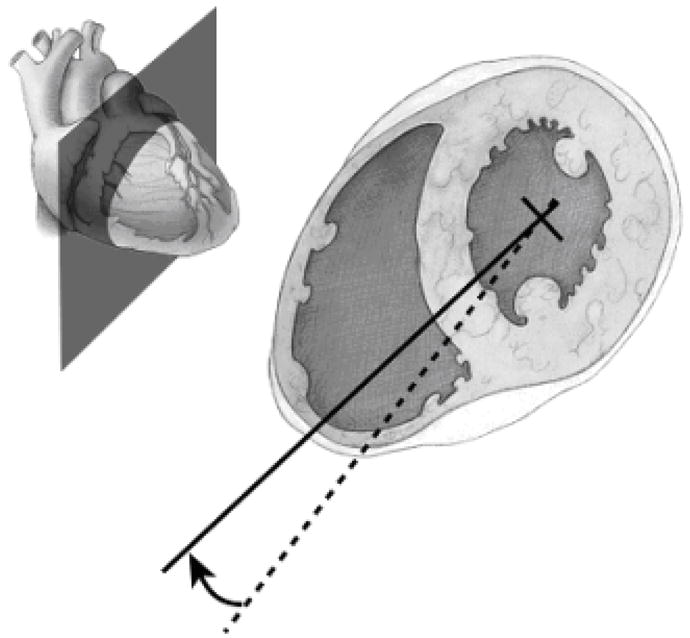
Fig. 7.

Illustration of the “turn” used to optimally visualize the right ventricle. A dashed line was the result of Step 3, the creation of the short axis stack. The dashed line defined a plane through the right ventricle, but this plane does not fully represent the size of the right ventricle. This can cause an underestimation of the right ventricular diameter on 4-chamber views. In Step 4, the dashed line is “turned” to the solid line, with the center point (cross-hairs) rotating through the center of the left ventricle. The plane defined by the solid line characterizes the full diameter of the right ventricle. The upper left-hand corner shows the plane illustrated with respect to the surface of the heart.
