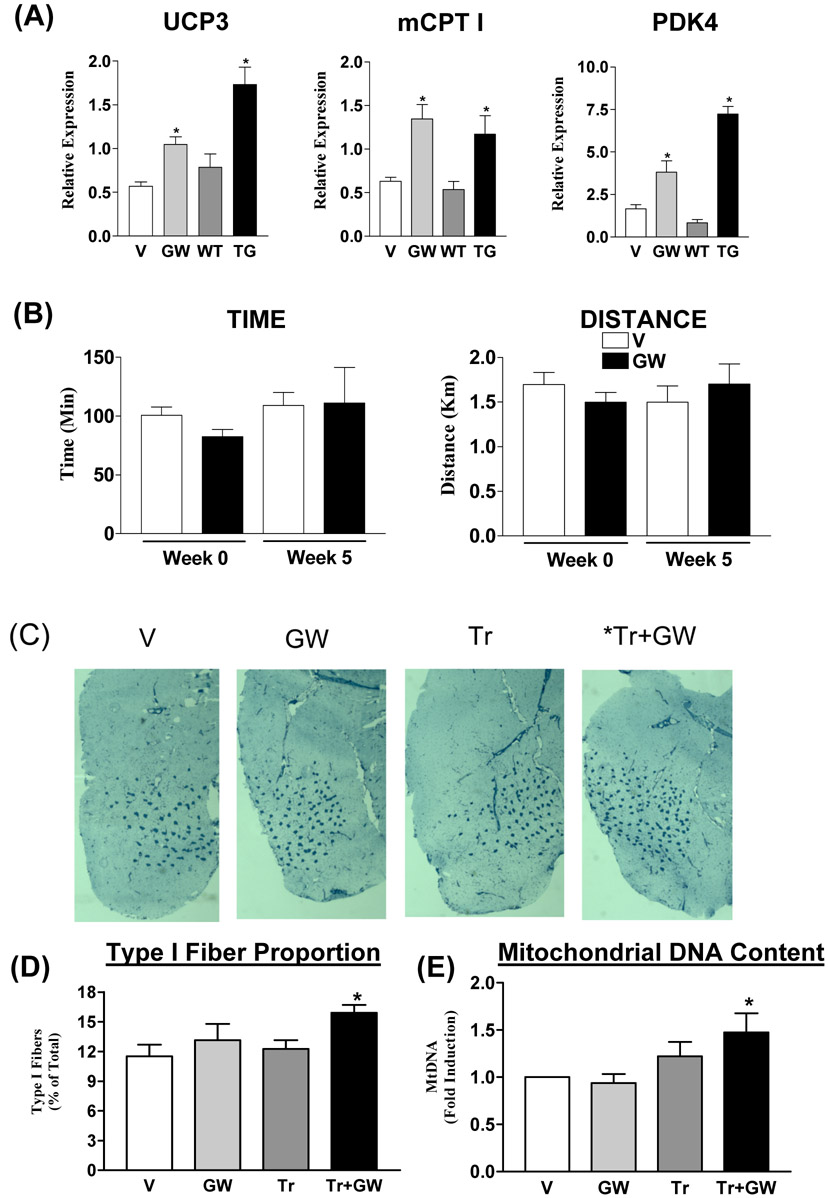
Figure 1. Synthetic PPARδ activation in mice.

(A) Relative gene expression levels of Ucp3, Cpt 1 and Pdk4 in quadriceps isolated from vehicle (V) and GW1516 (GW)-treated wild type mice as well as from muscle VP16-PPARδ transgenic (Wang et al., 2004) (TG) and non-transgenic (WT) littermates. Data is presented as mean±SEM (N=4-9). * Indicates statistically significant differences between GW and V groups or TG and WT groups (p<0.05, Unpaired student’s t test). (B) Running endurance in sedentary mice. Endurance was tested in V (open bars) and GW (black bars)-treated wild type mice before (Week 0) and after (Week 5) treatment. Data is represented as mean±SD (N=6). (C) Representative meta-chromatically stained frozen gastrocnemius cross-sections from vehicle-treated sedentary (V), GW1516-treated sedentary (GW), vehicle-treated exercised (Tr) and GW-treated exercised (Tr+GW) mice. Type I fibers are stained dark blue. (D) Type I fiber quantification (N=3). (E) Fold change in mitochondrial DNA to nuclear DNA ratio (N=9). Data in (D) and (E) are presented as mean±SEM. * Indicates statistical differences between V and indicated groups (p<0.05, One Way ANOVA; post hoc: Dunnett’s Multiple Comparison Test).
